NOTE: Here are some older figures I generated with different datasets (primarily Ponterra Points PON001-100). I’ll get this updated to match code in other tabs and a consistent subset of data.
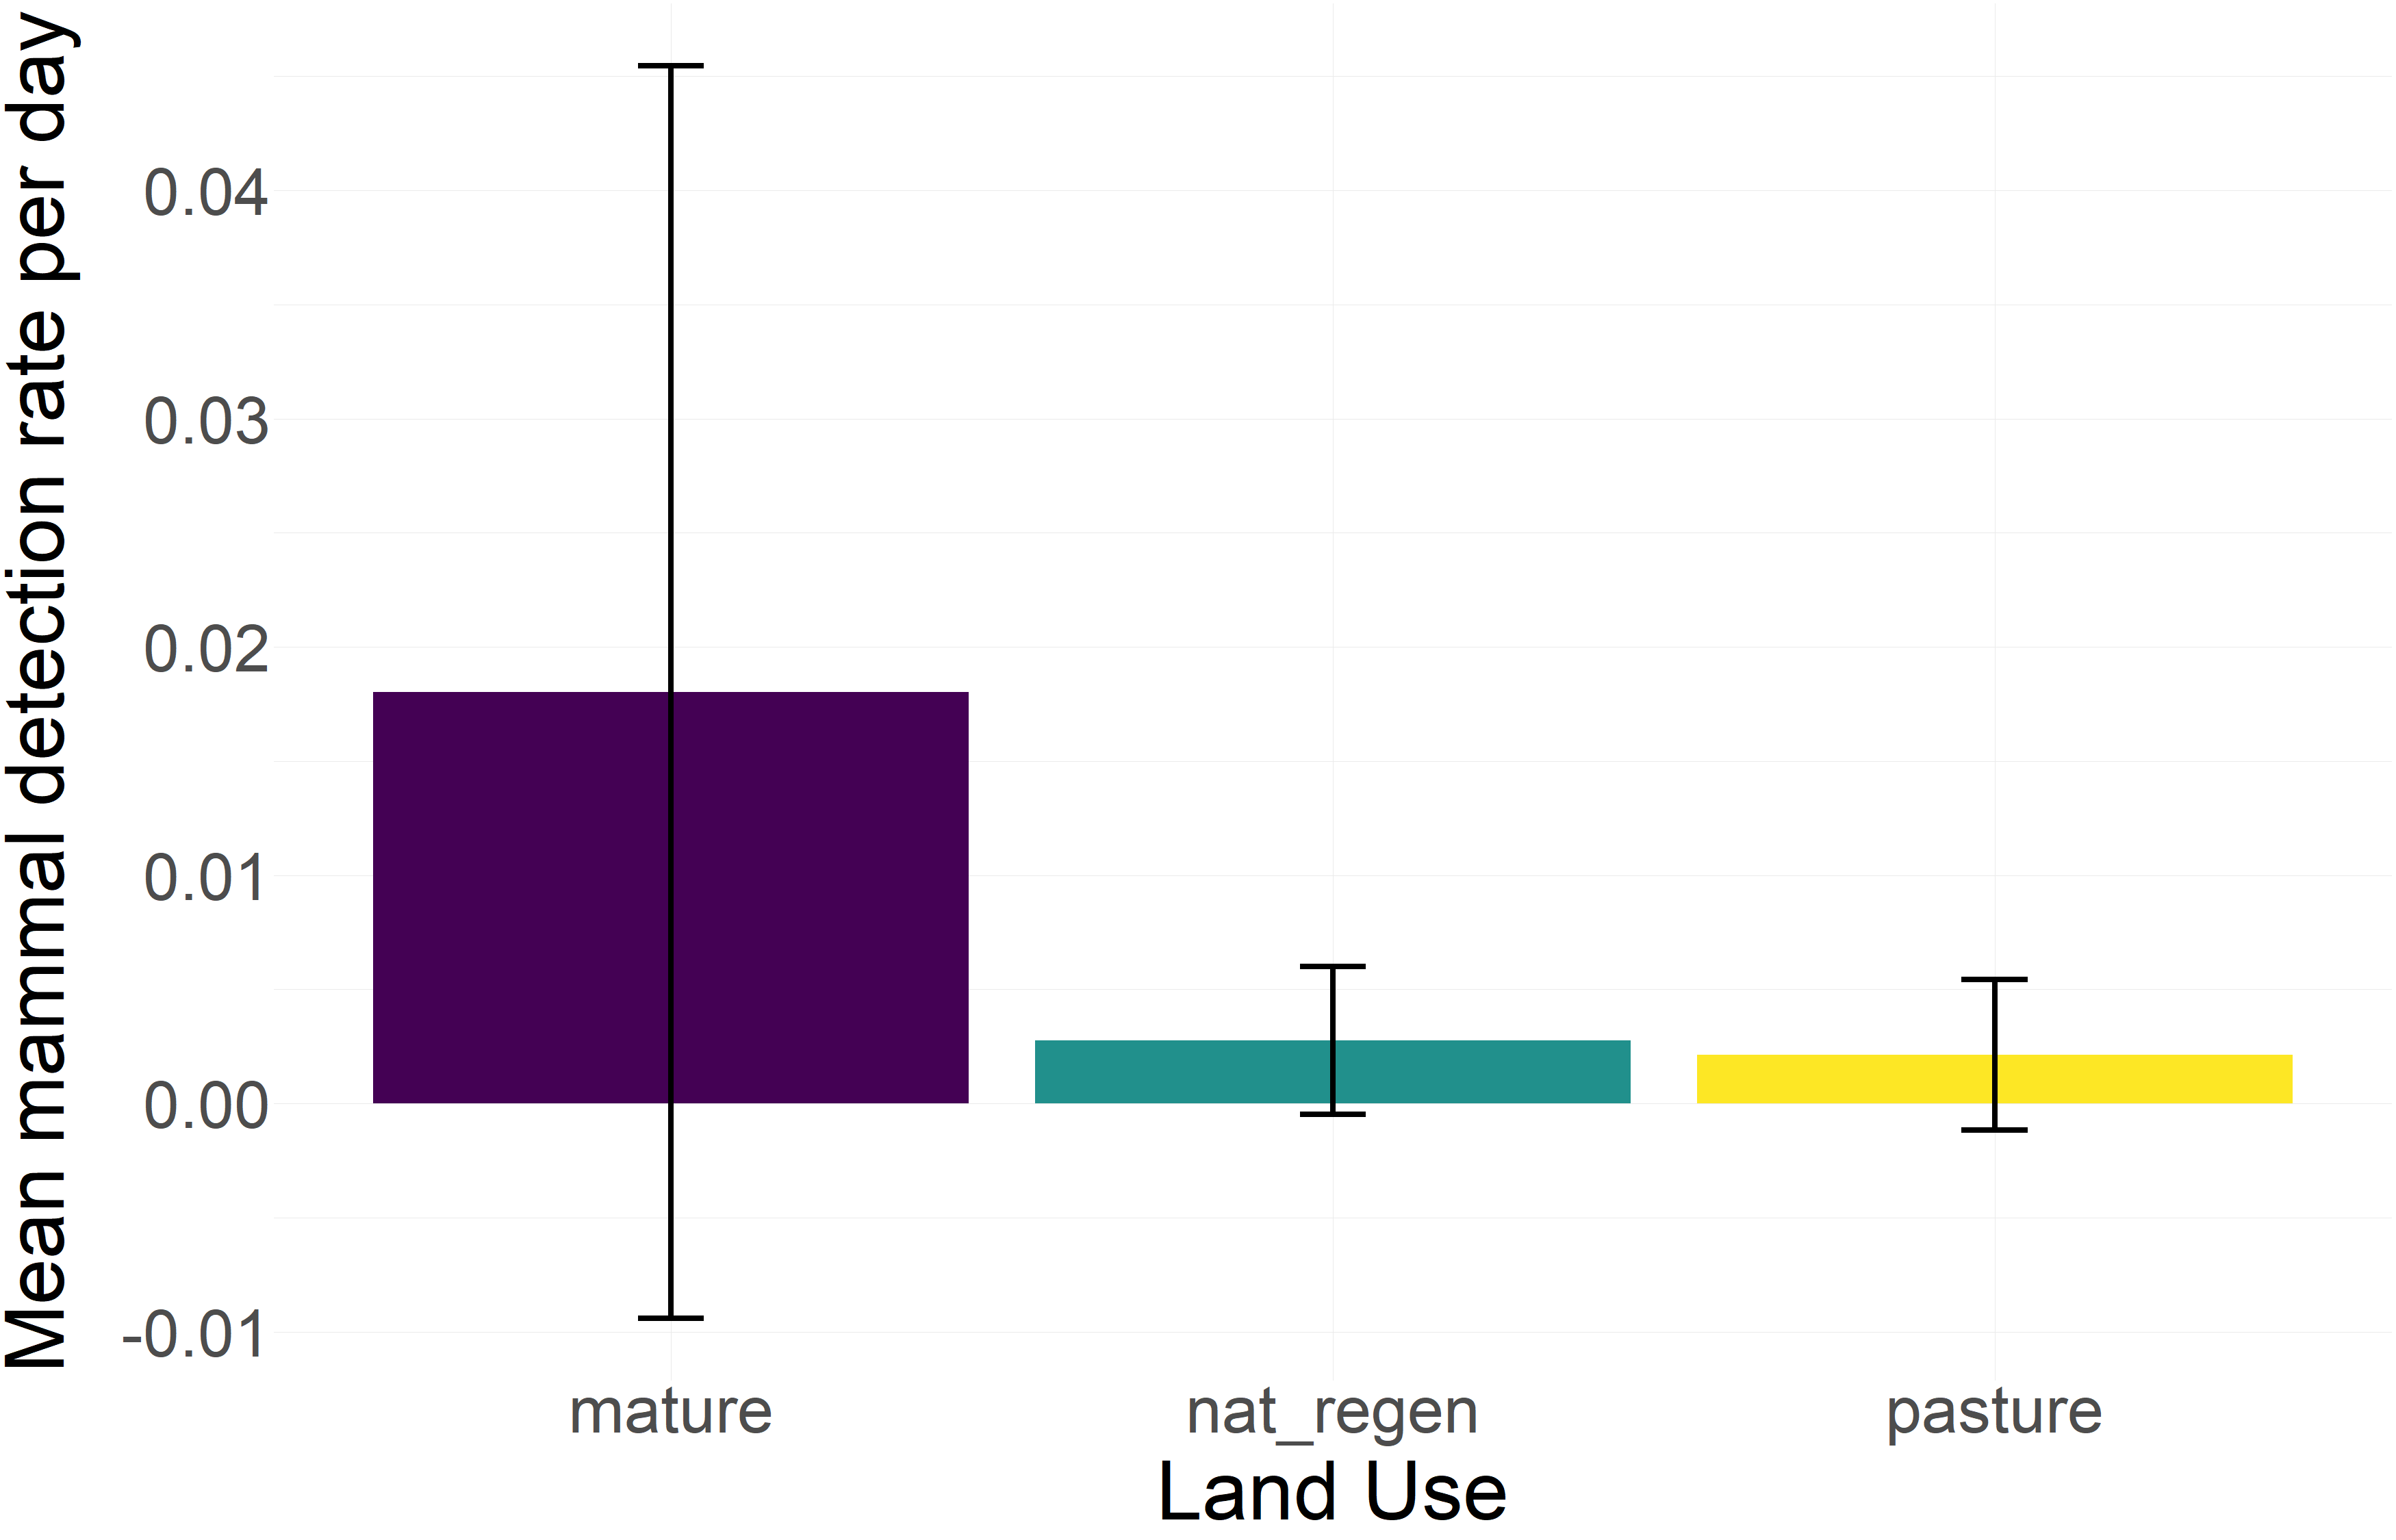
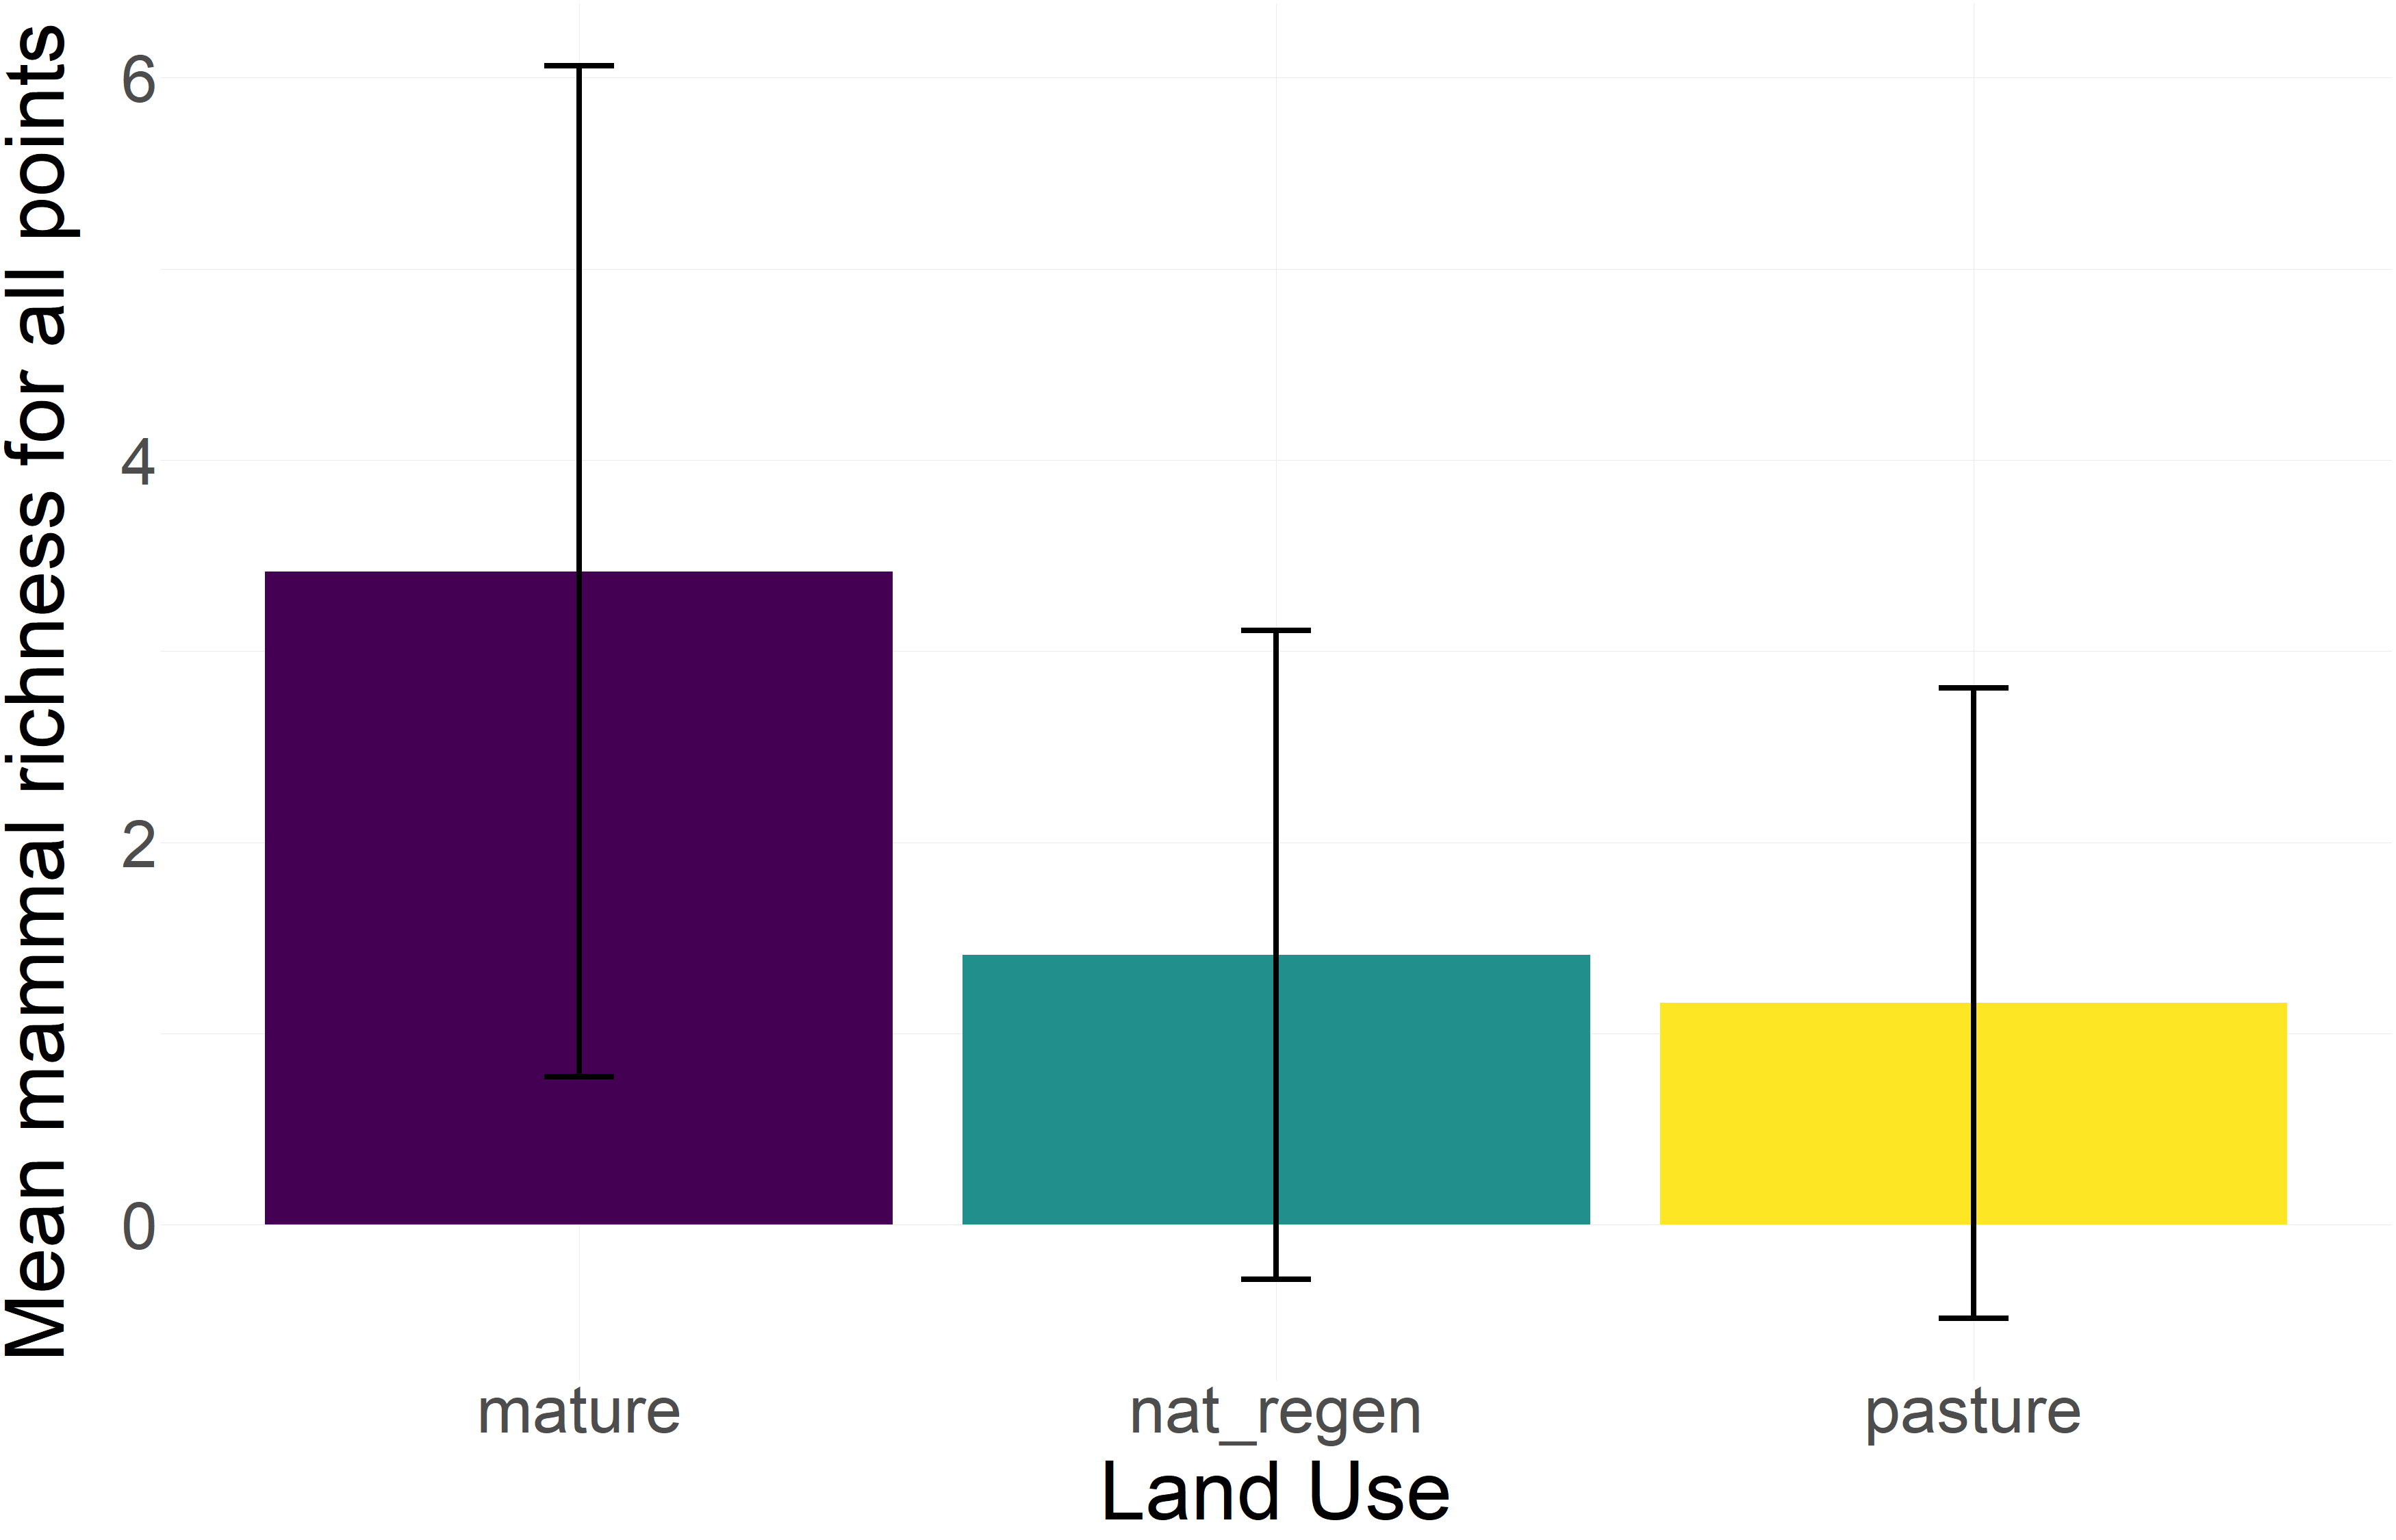
Mammals
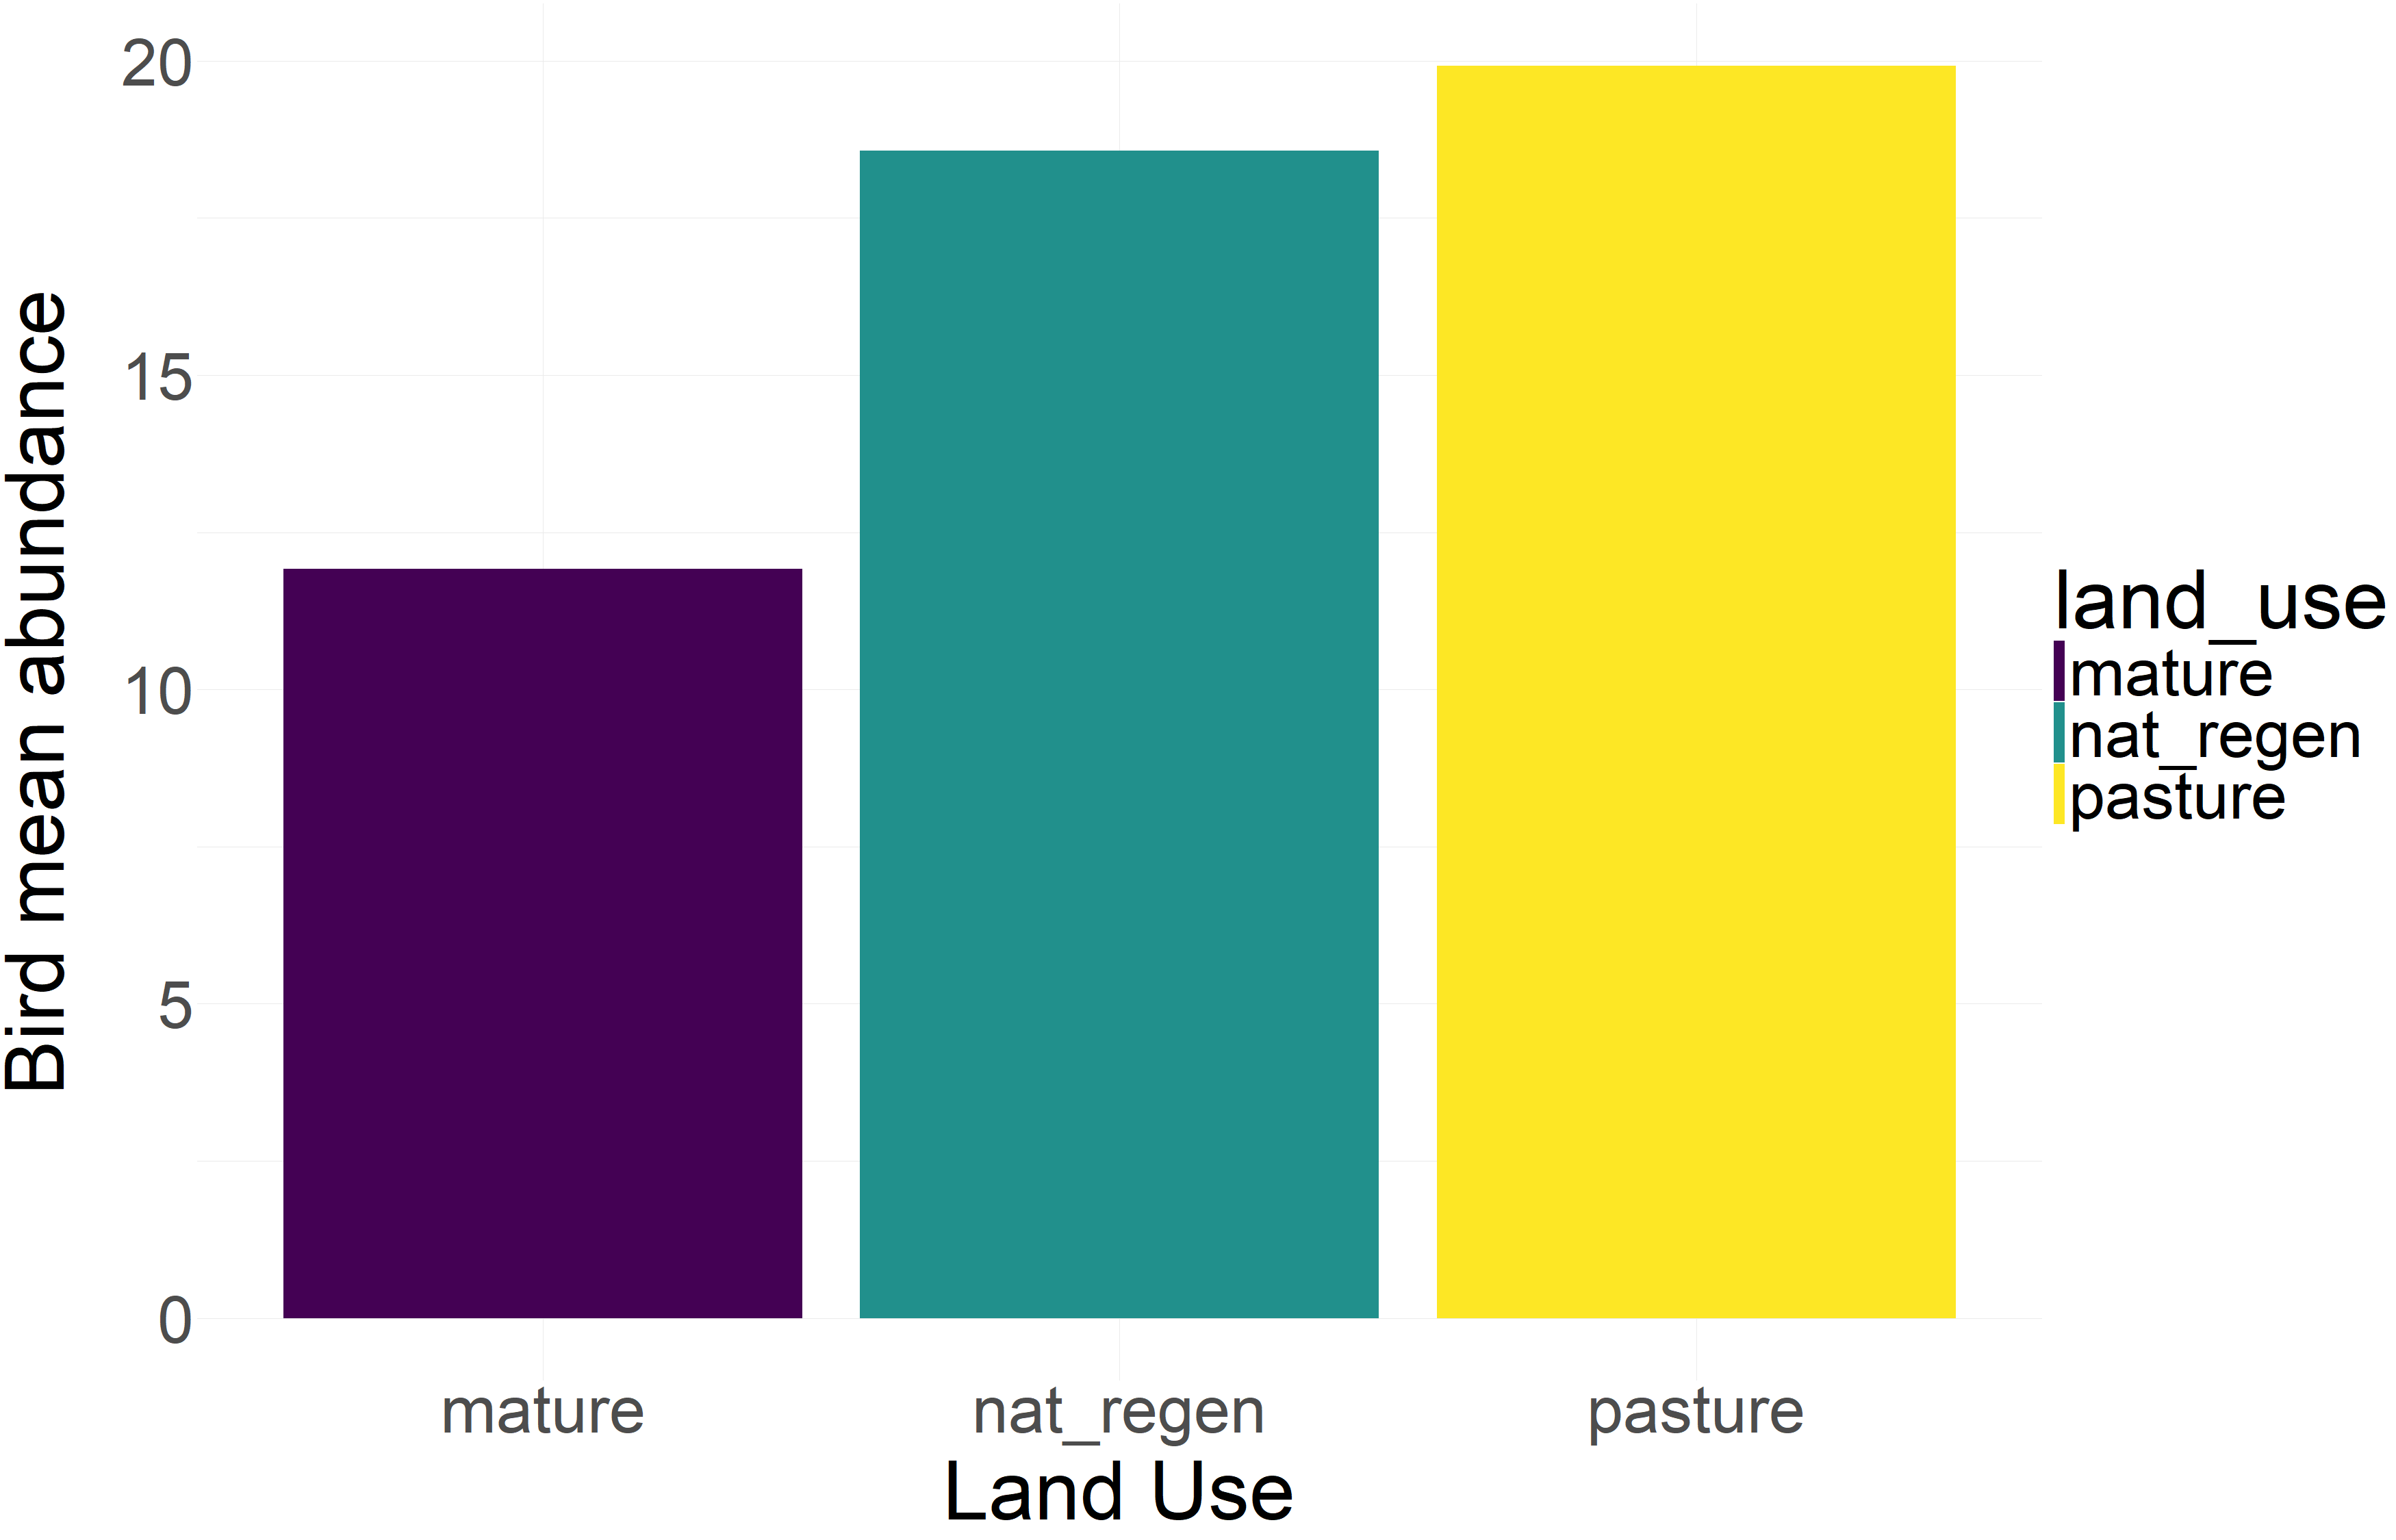
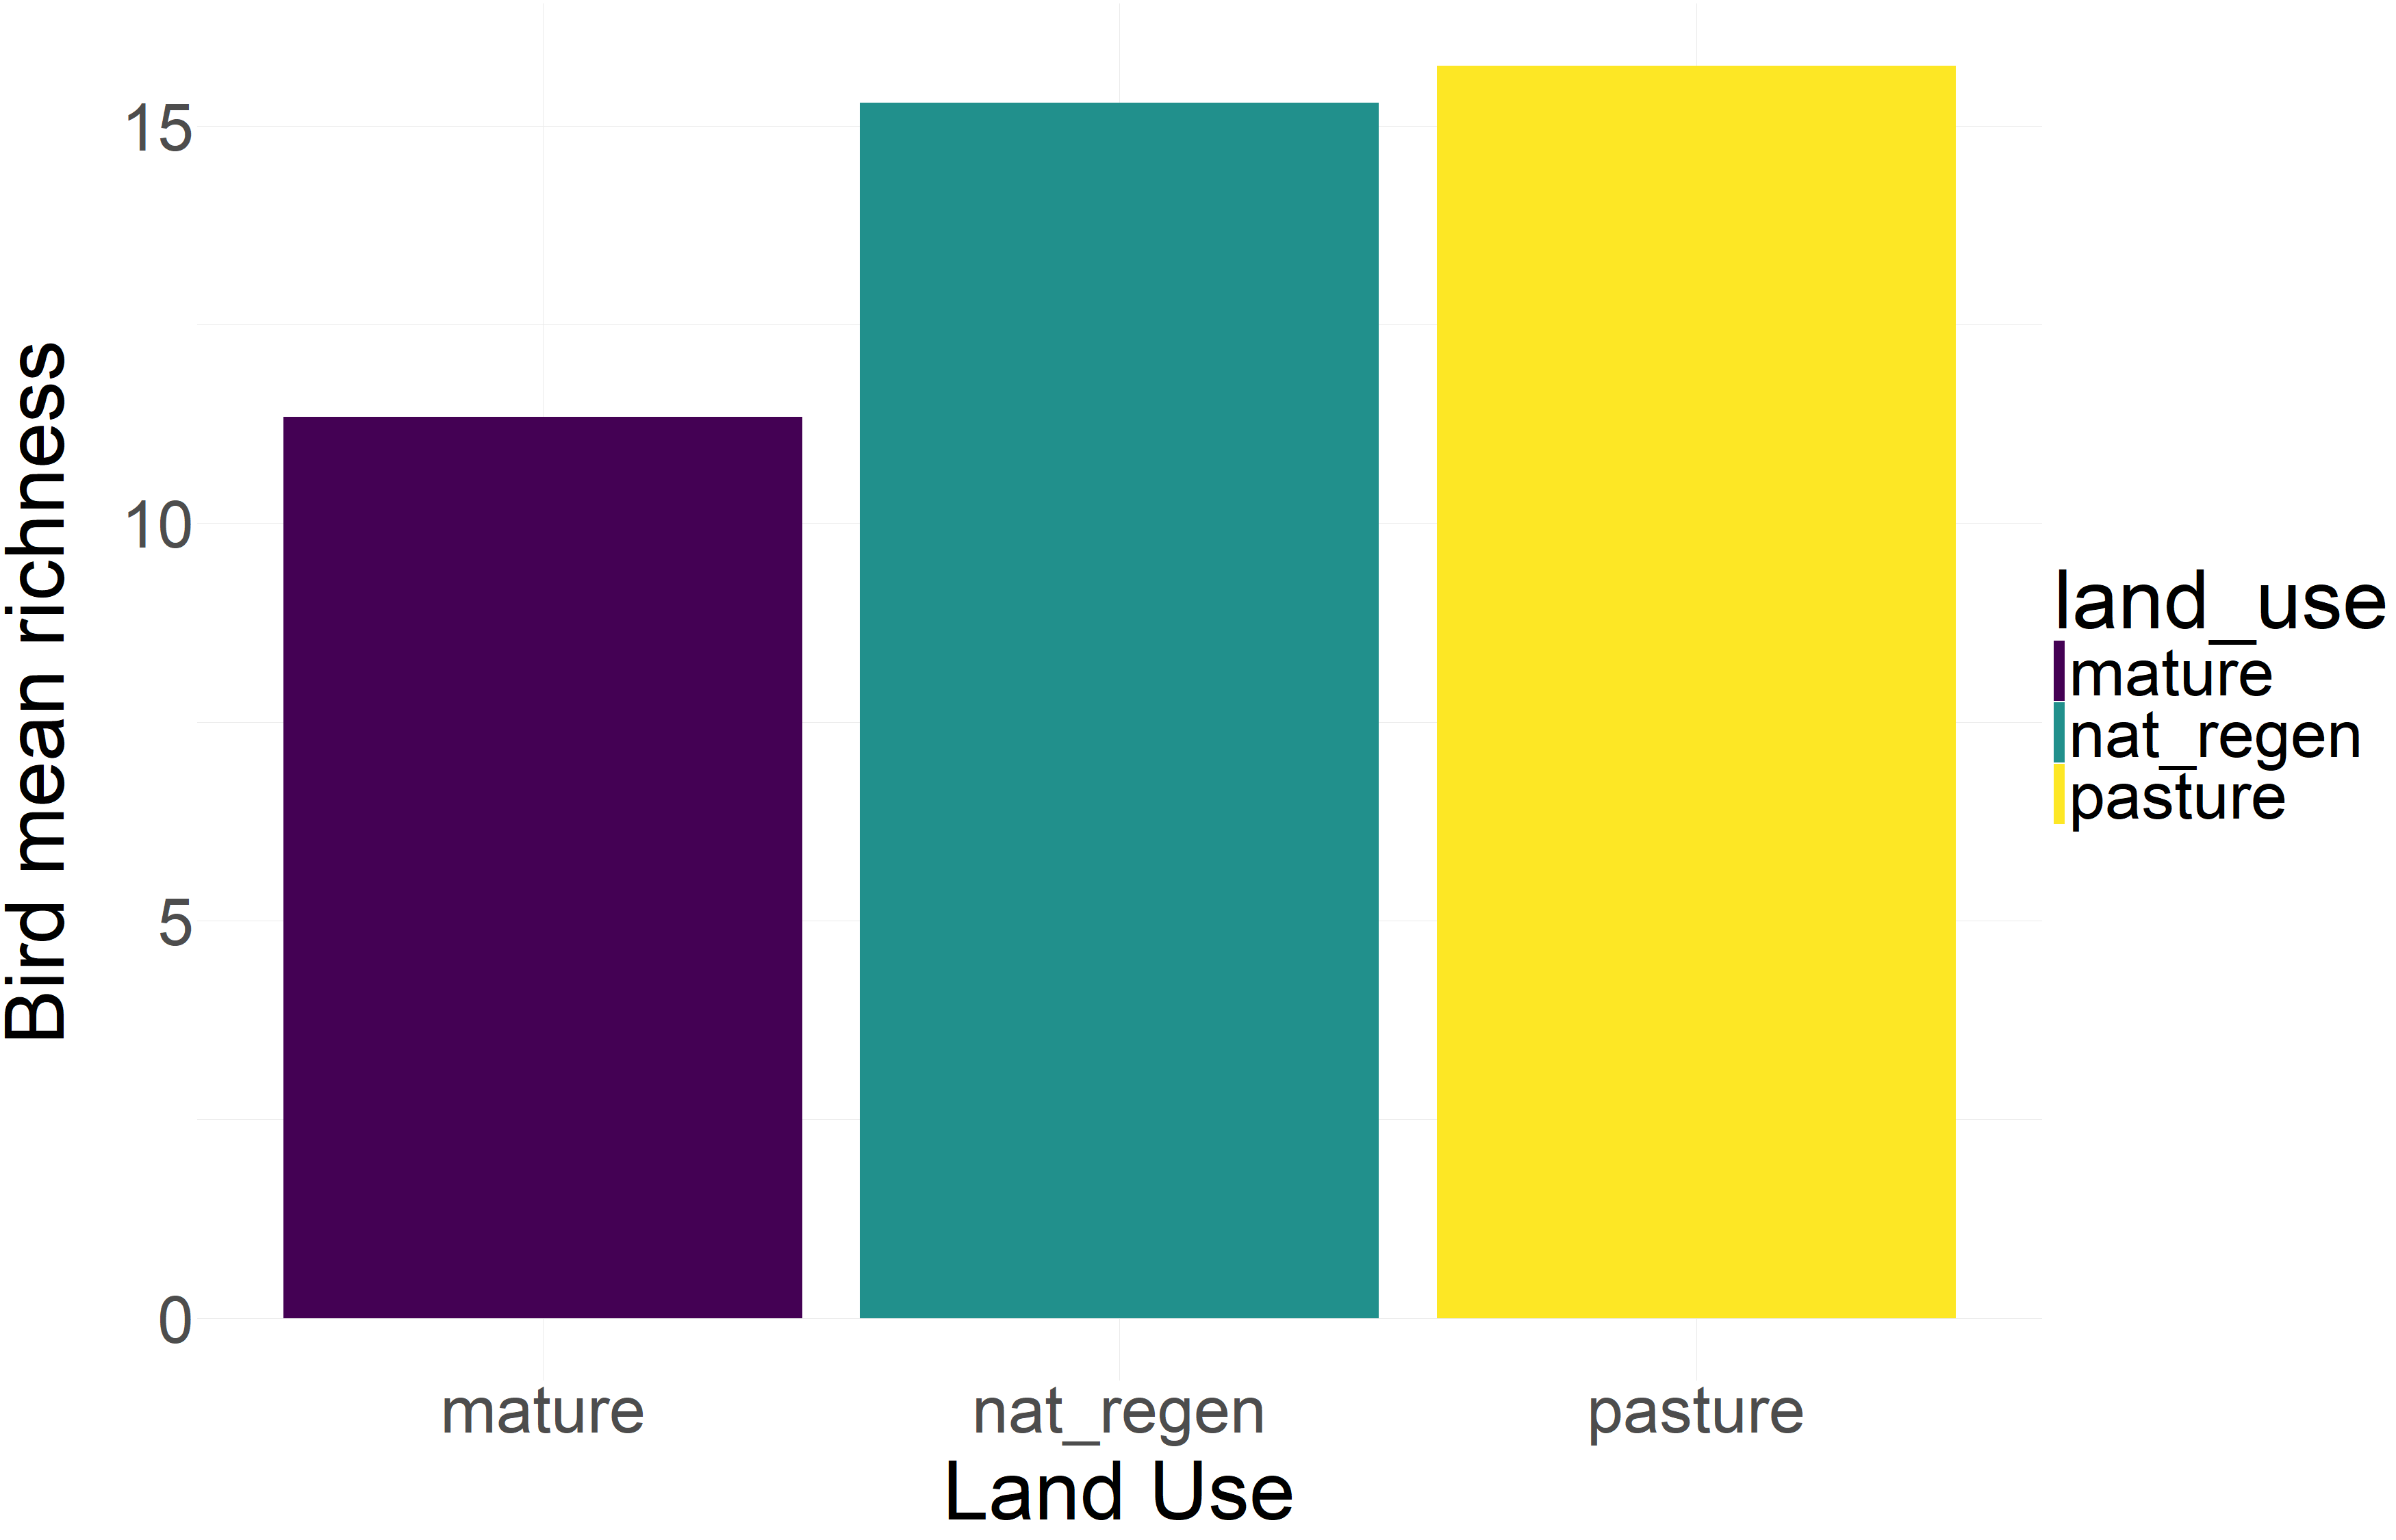
Bird point counts
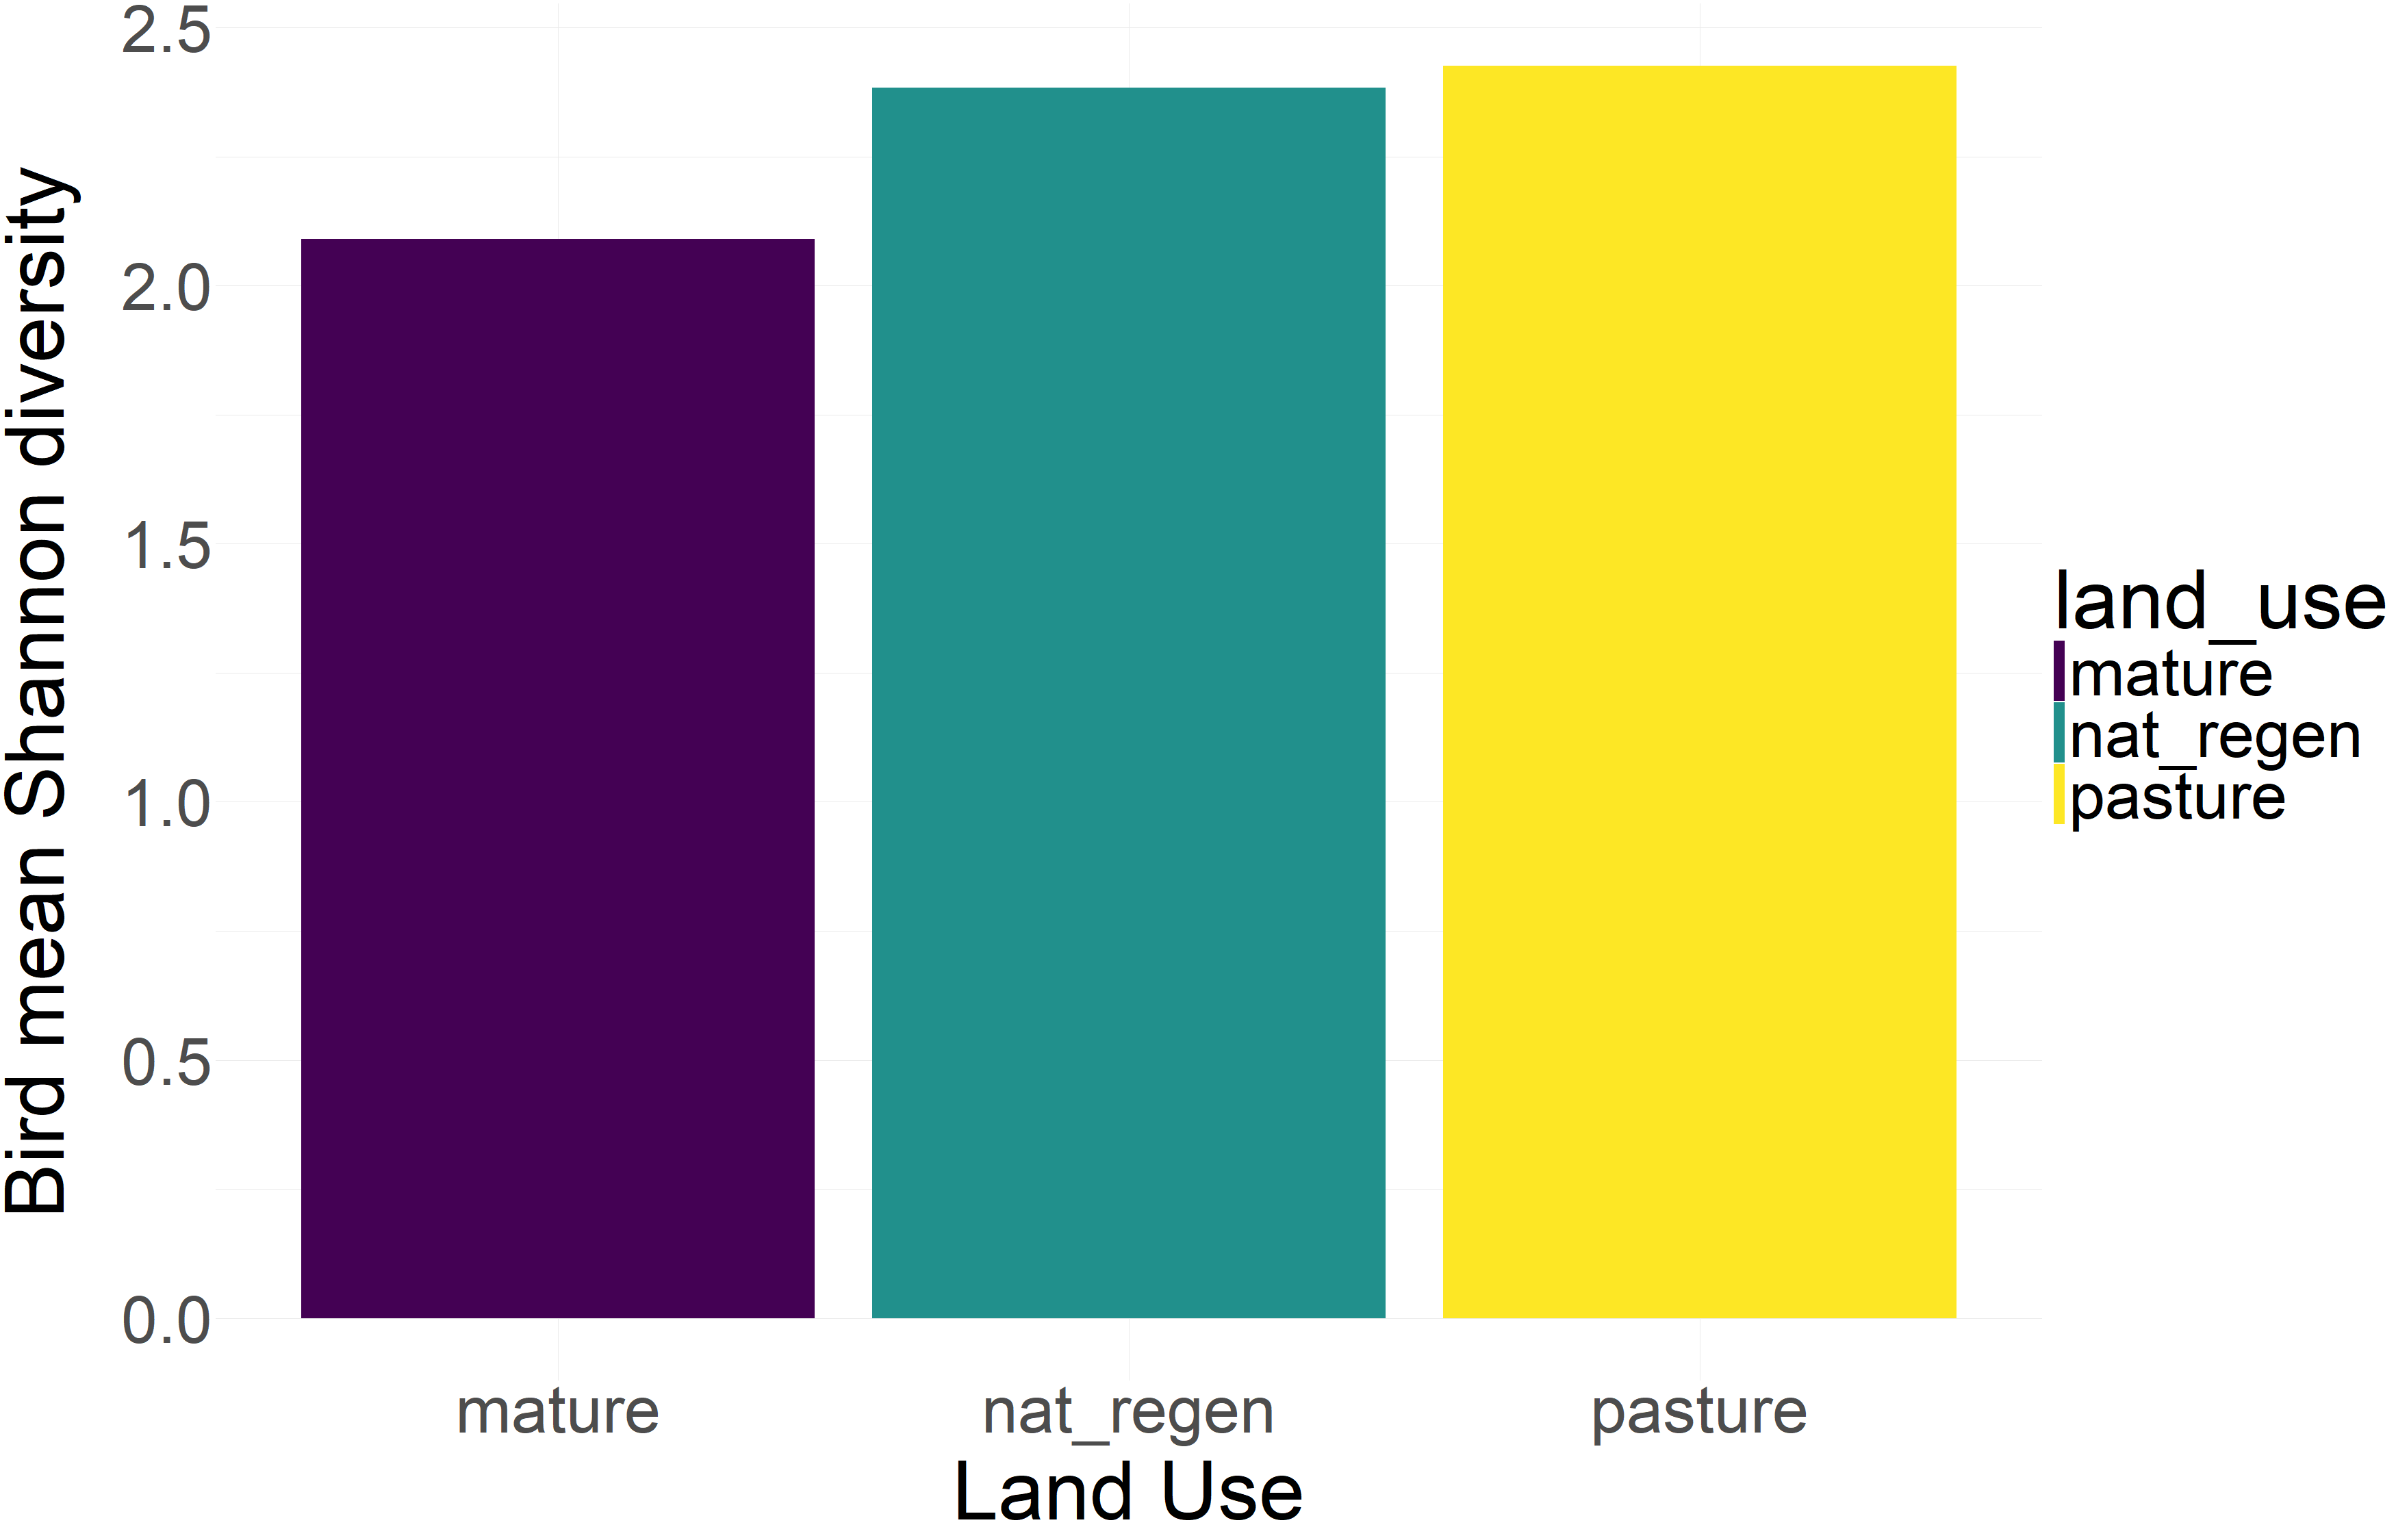
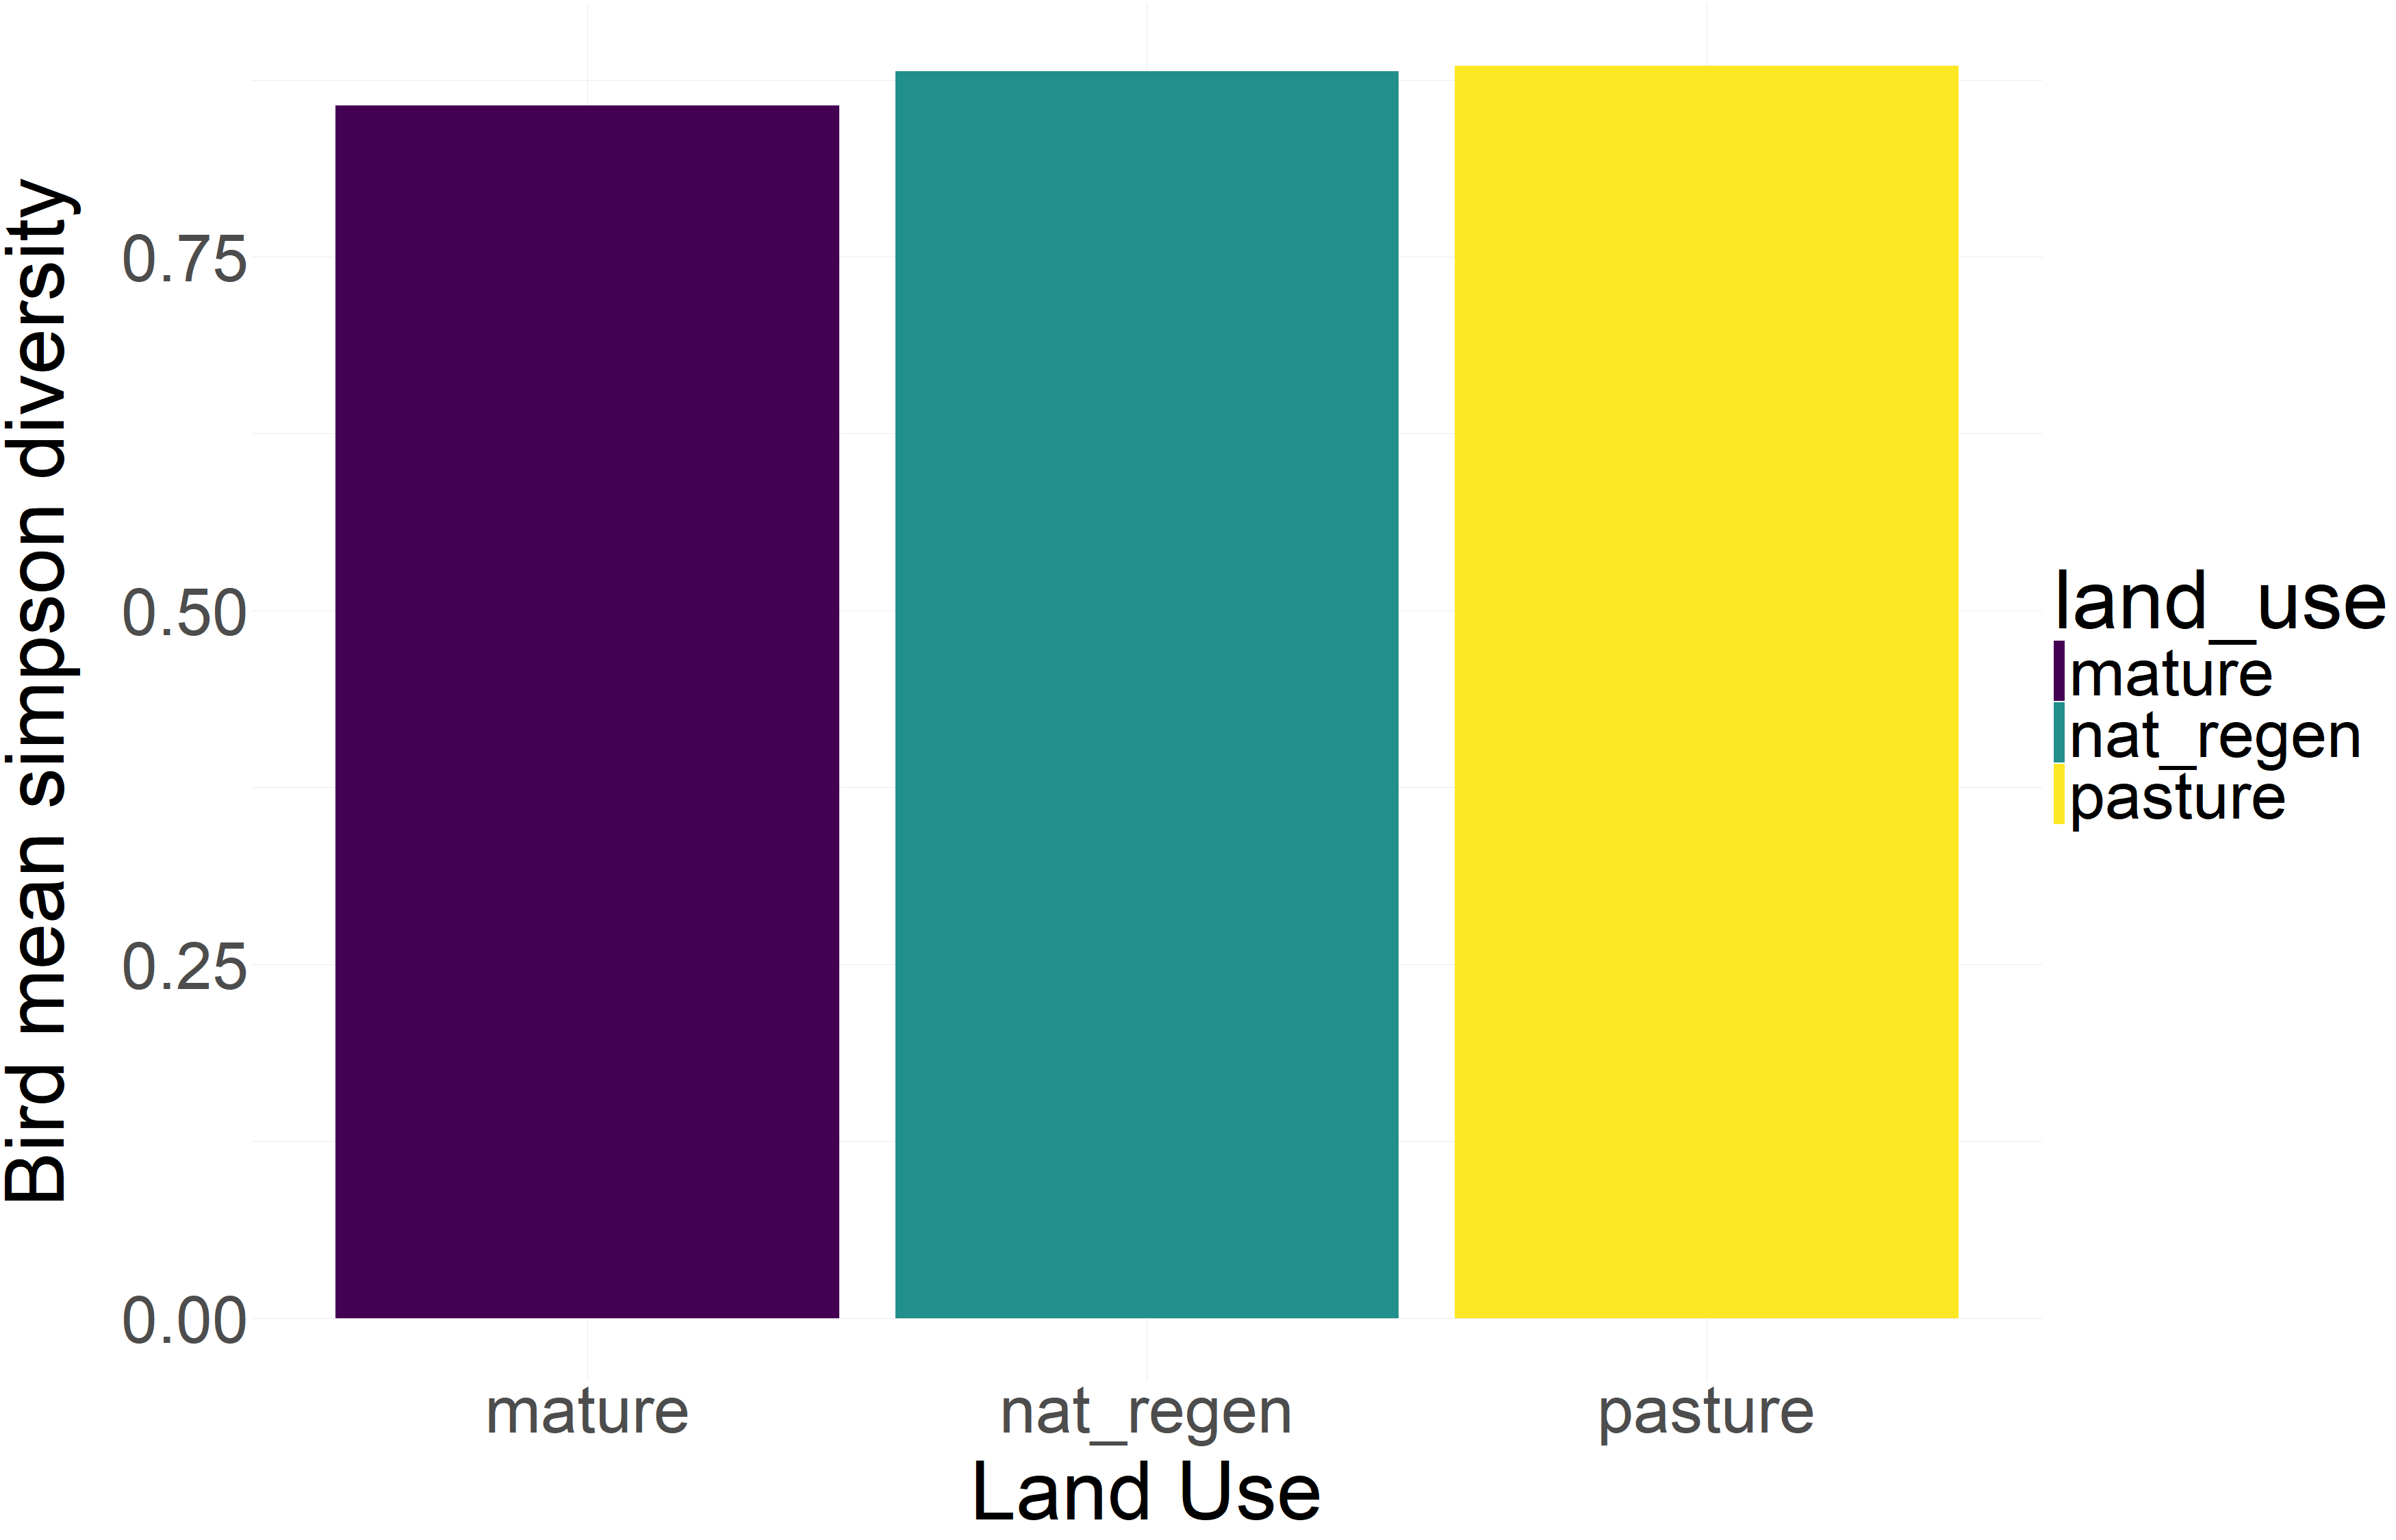
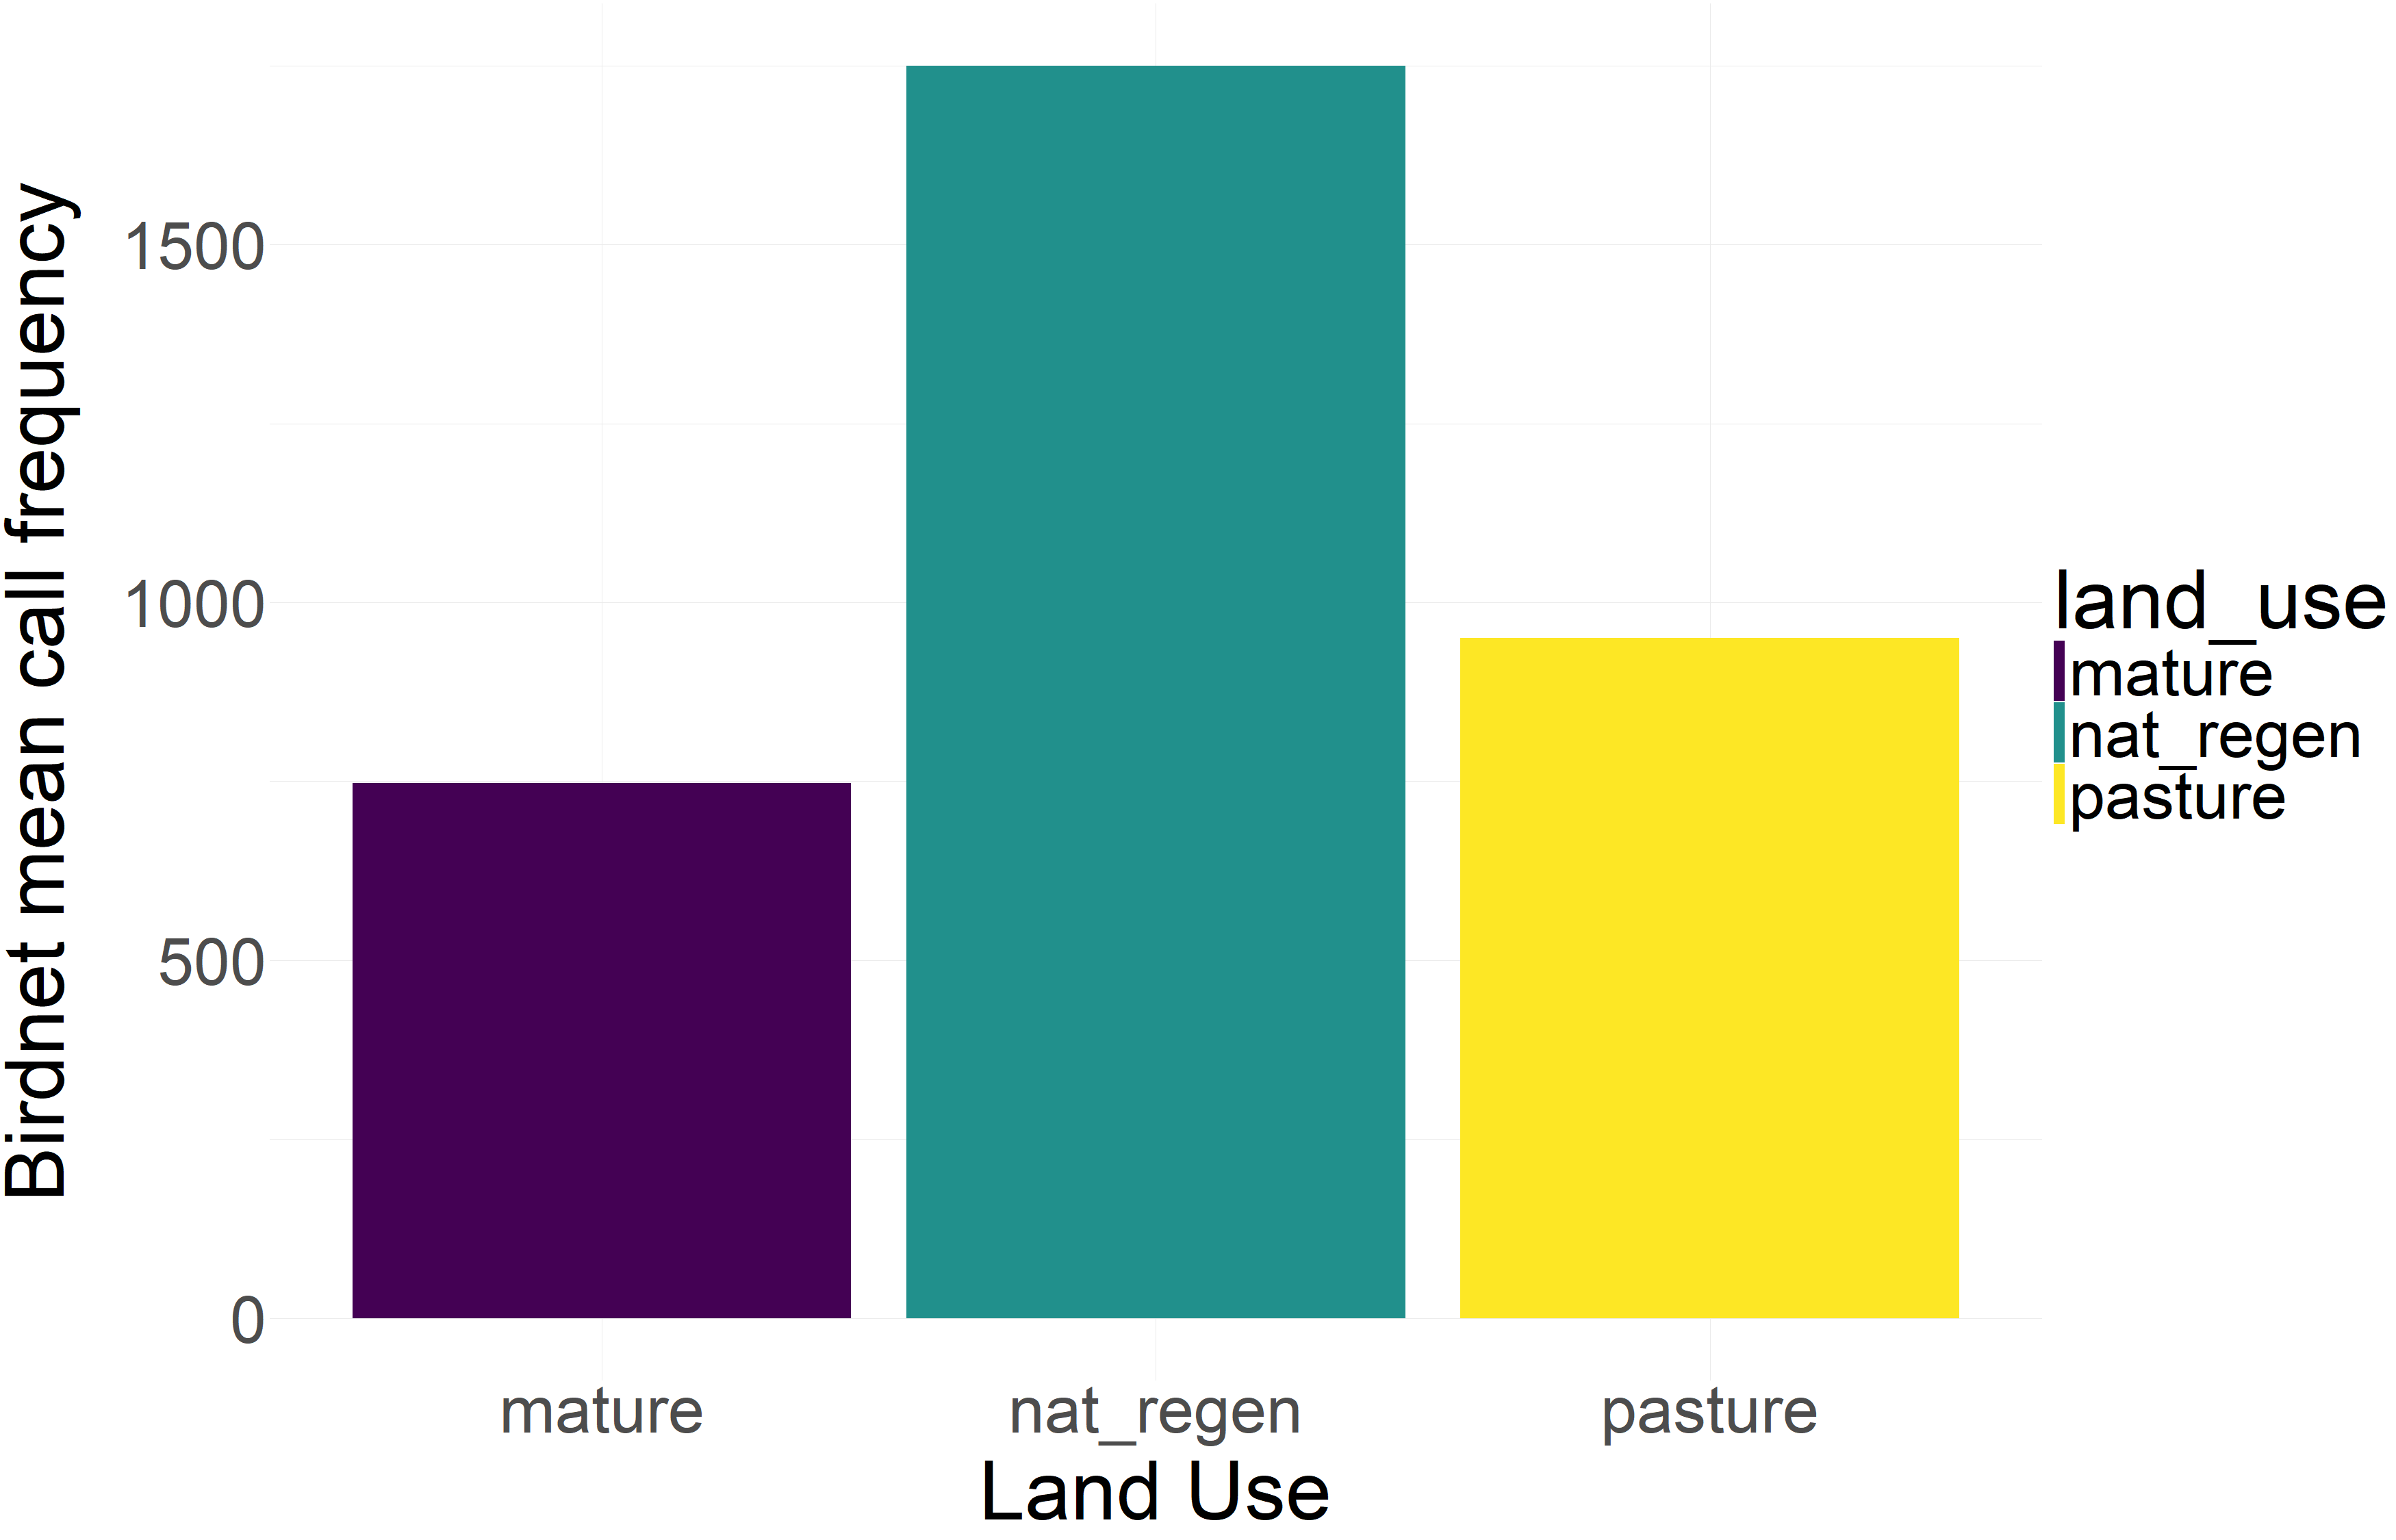
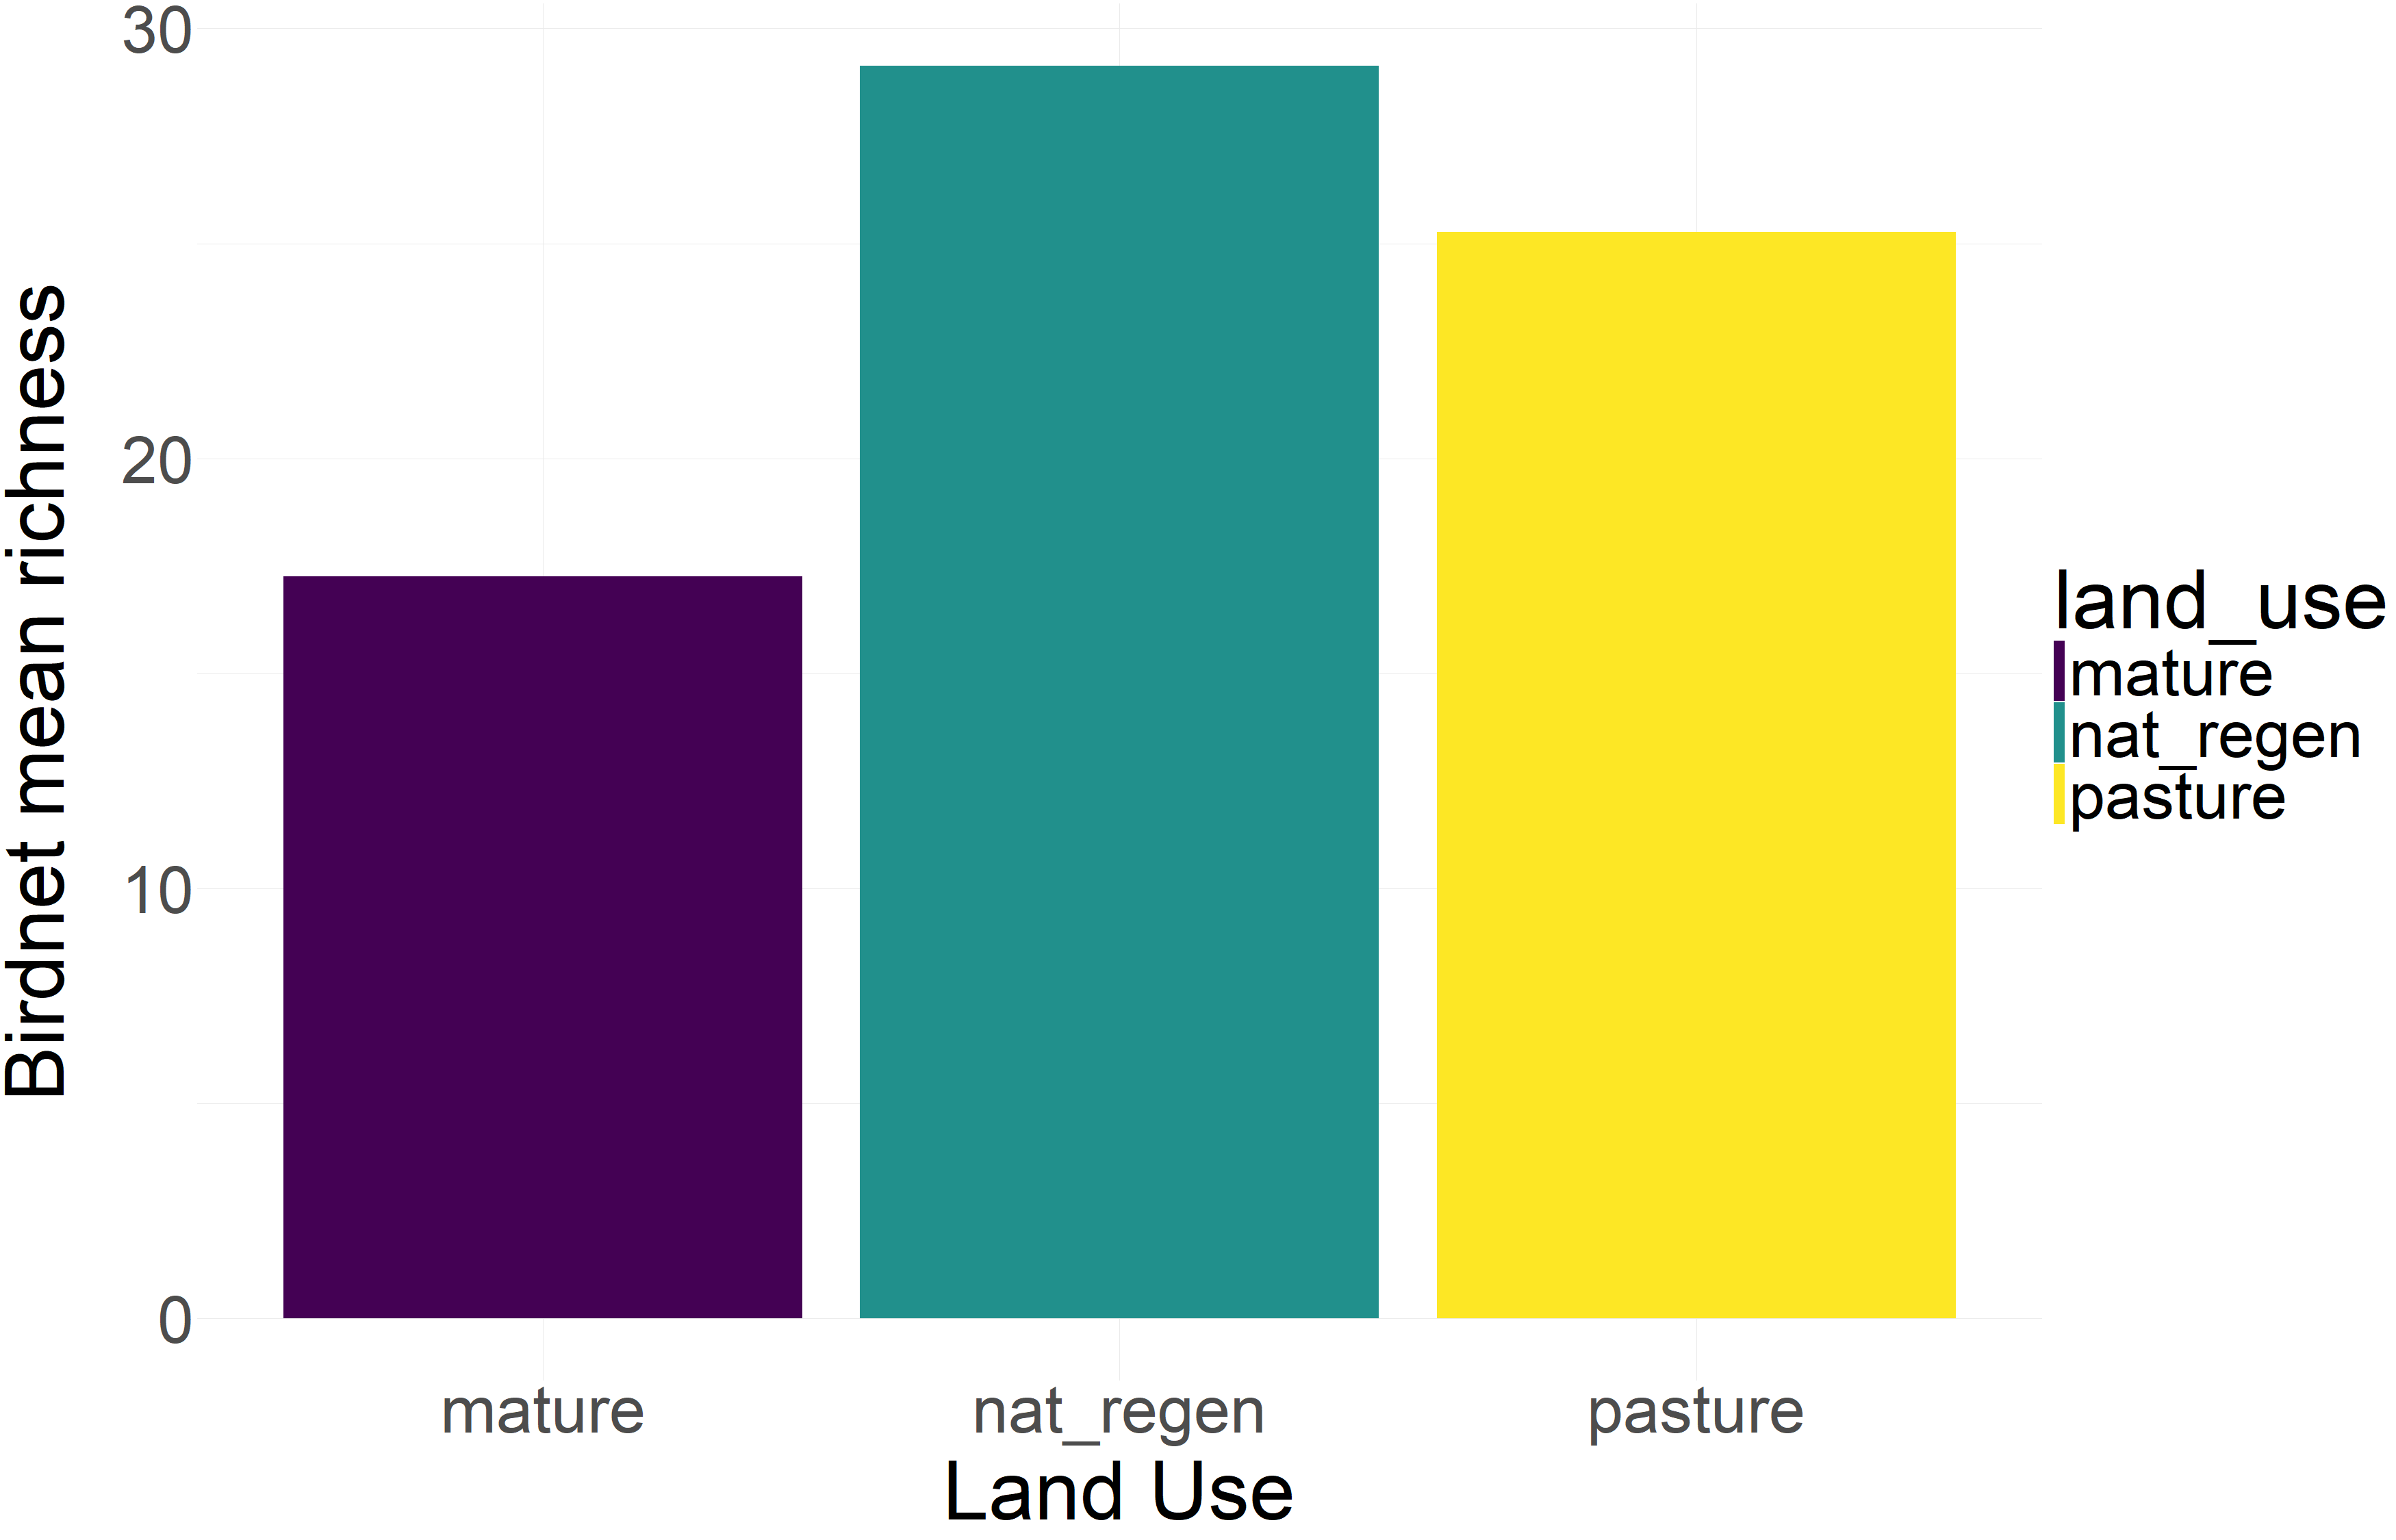
Bird passive acoustic monitoring
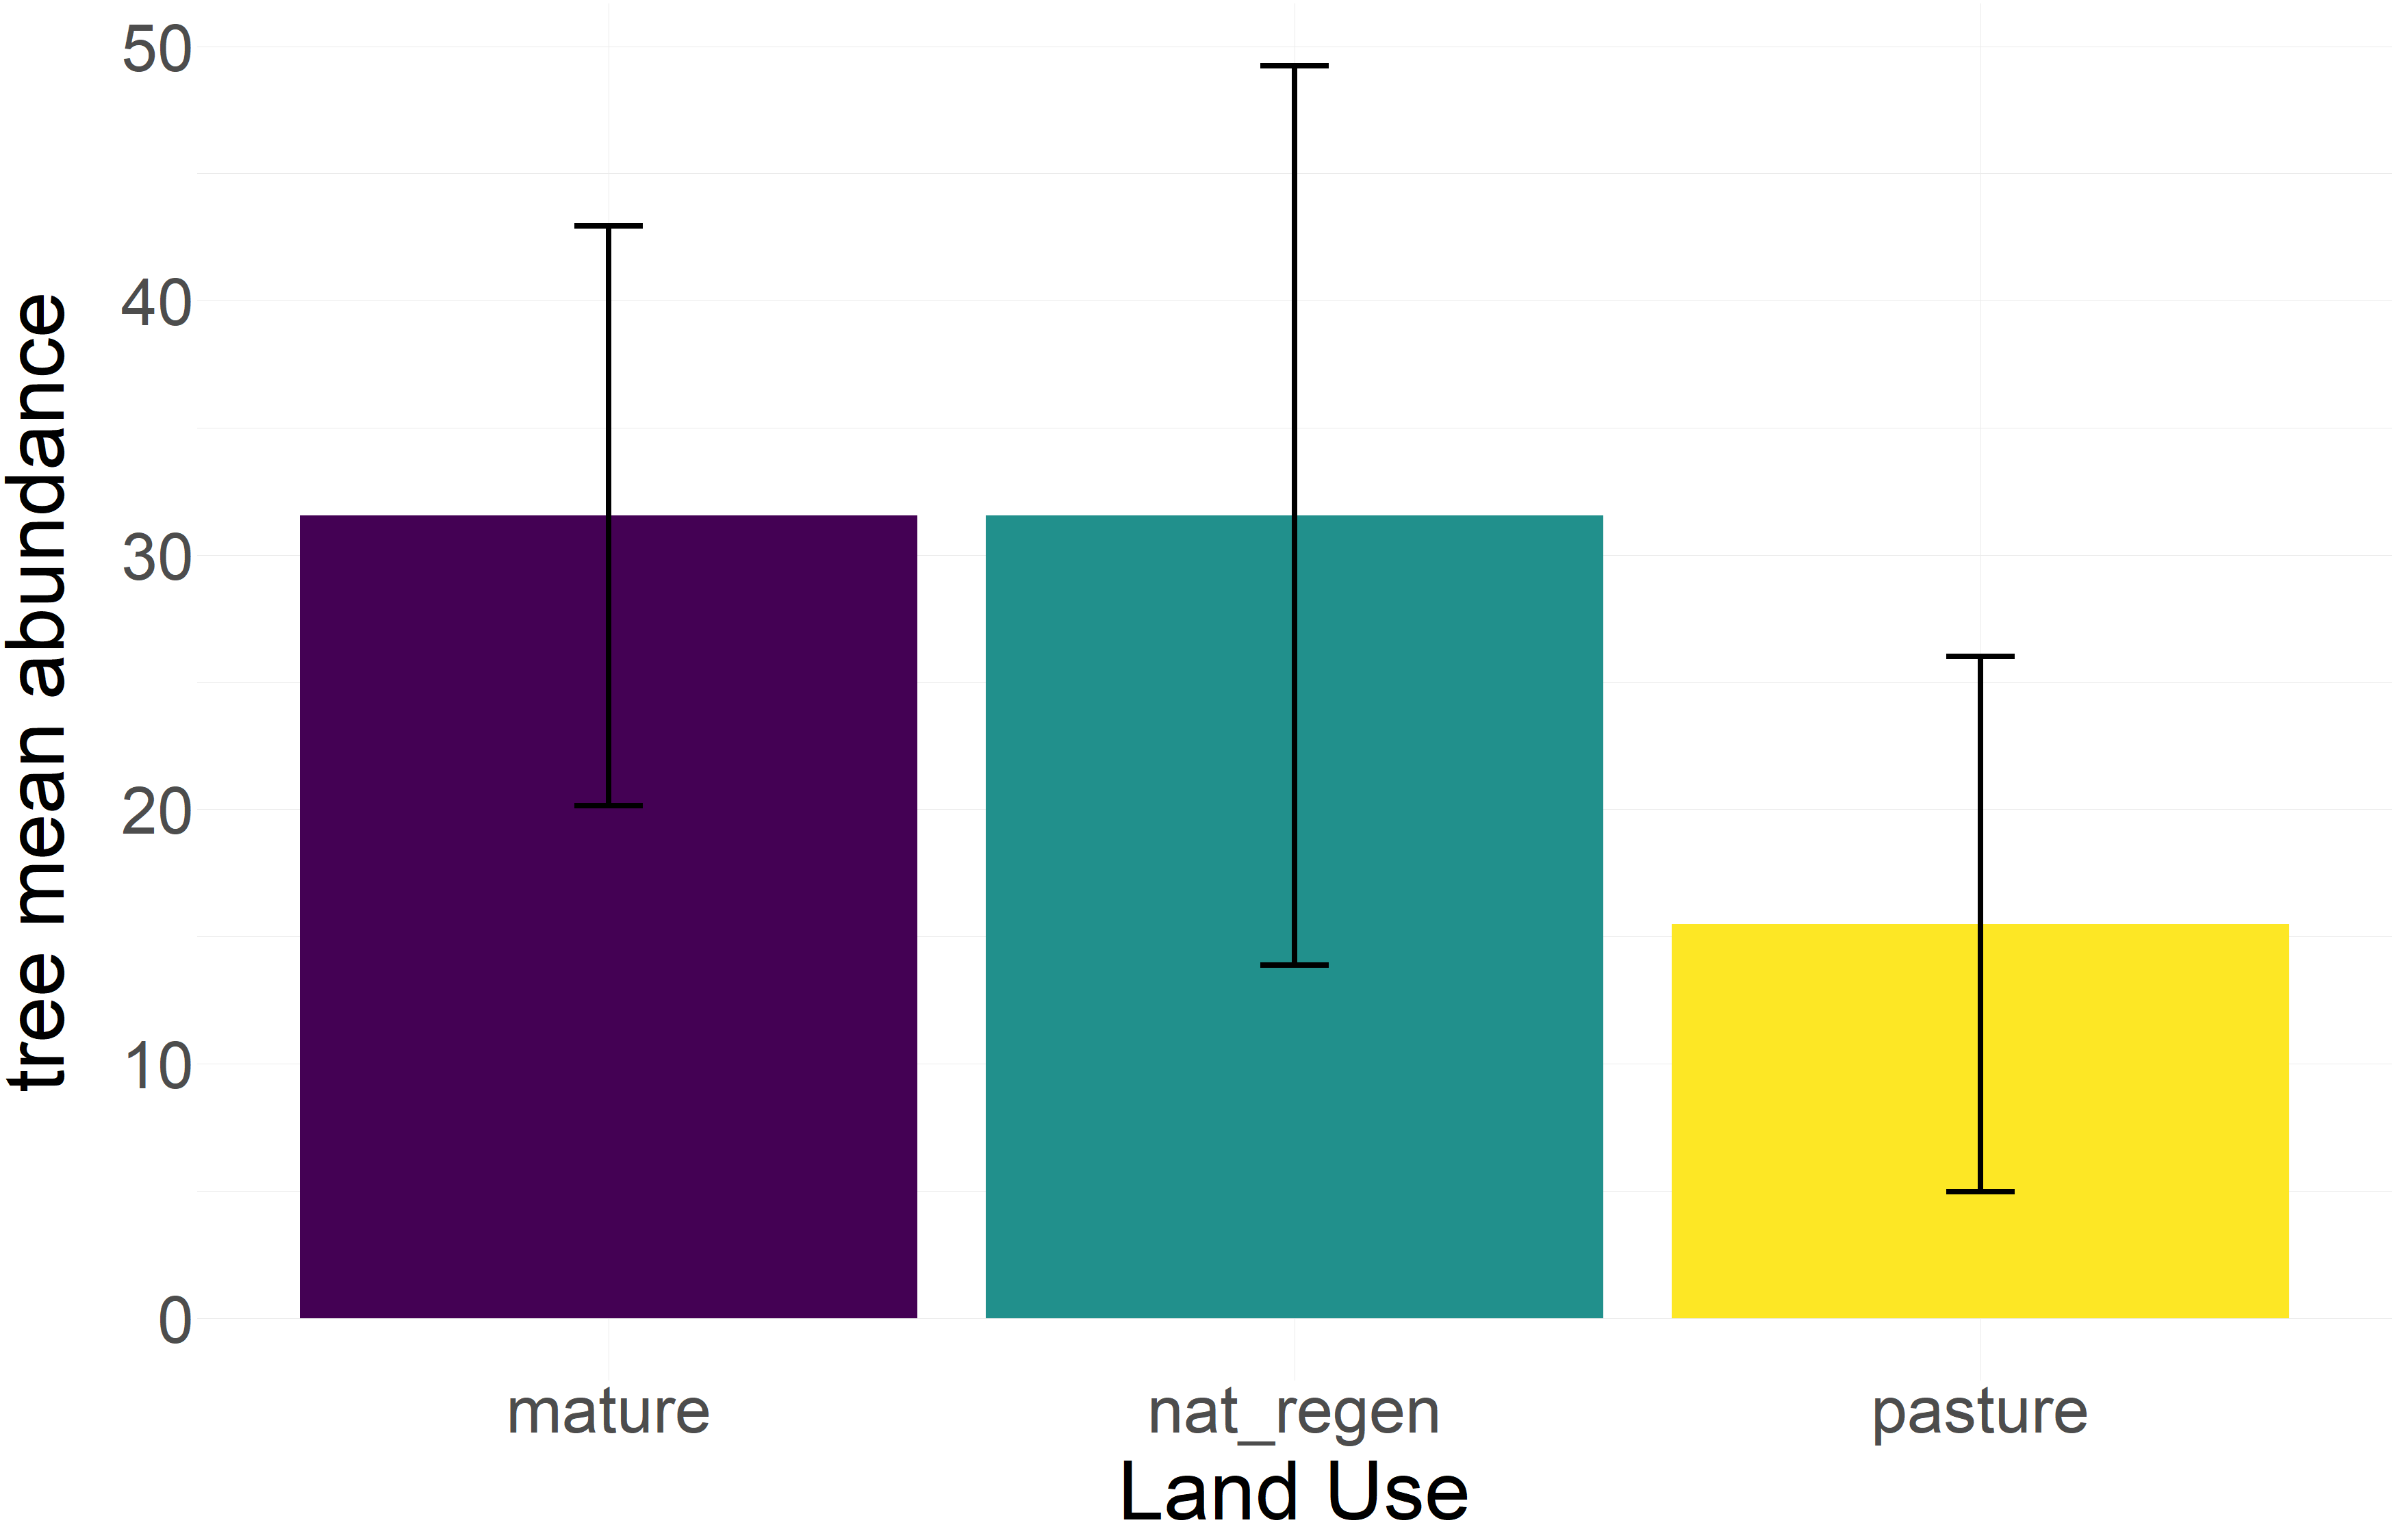
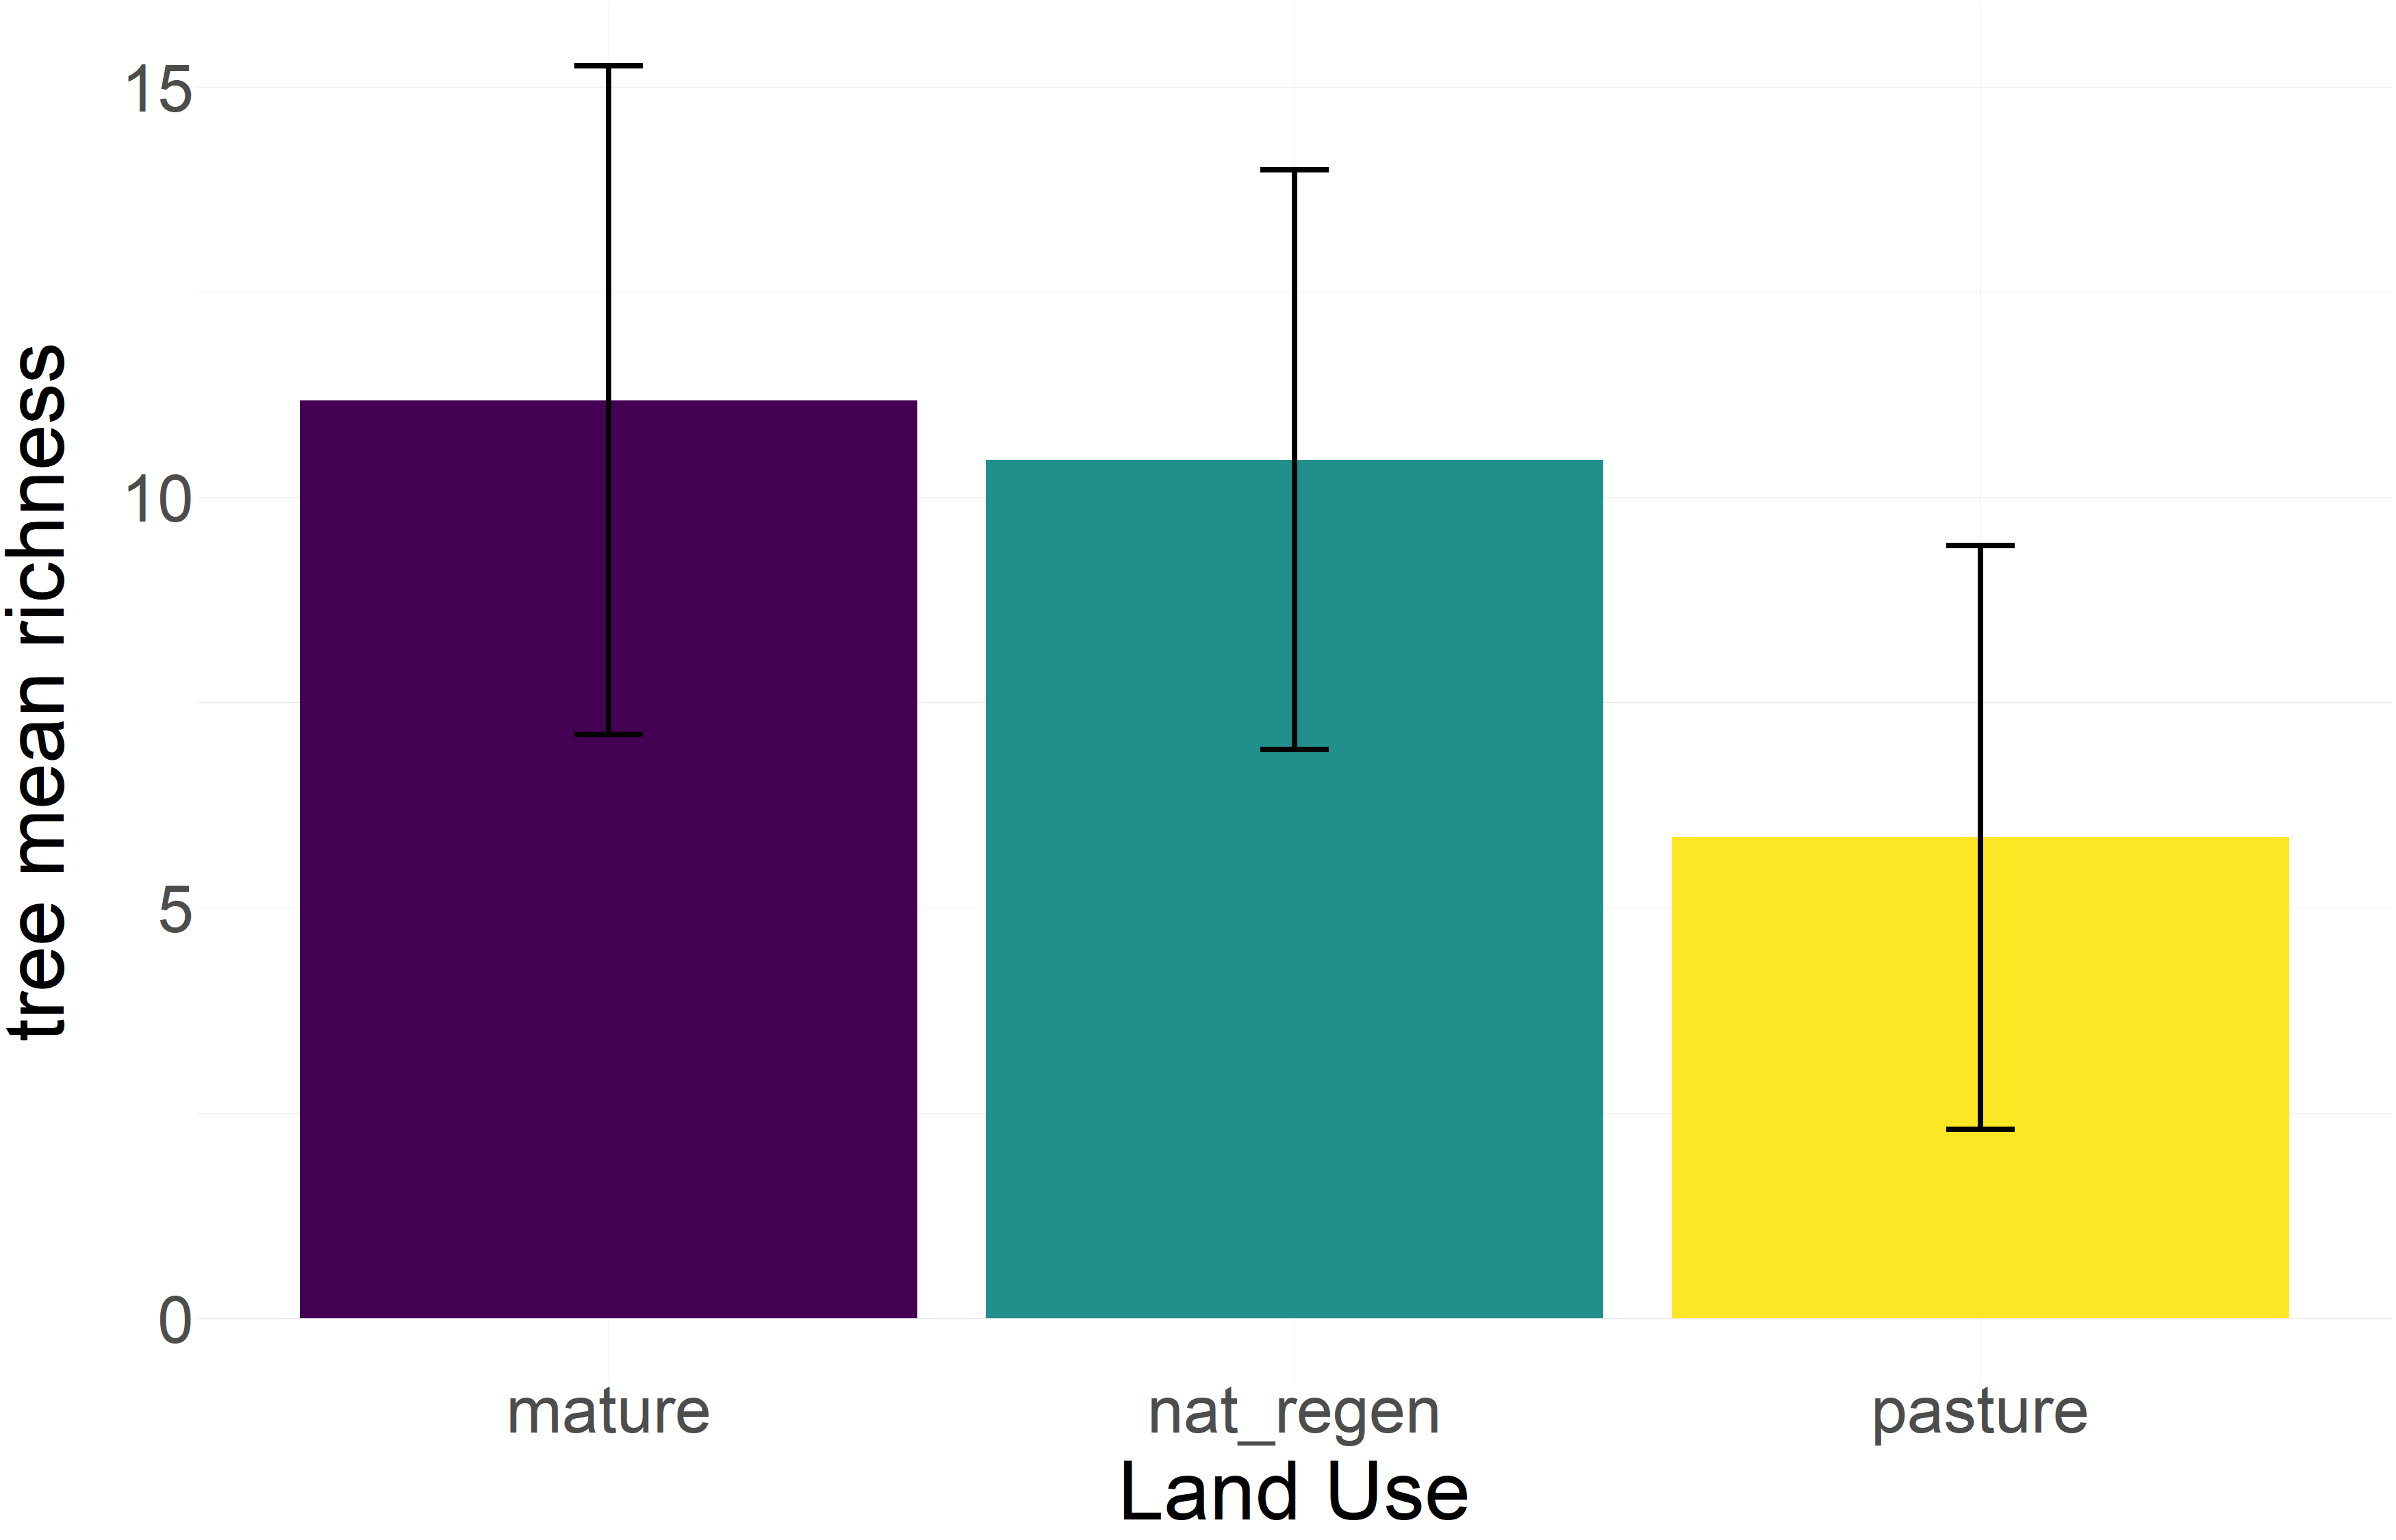
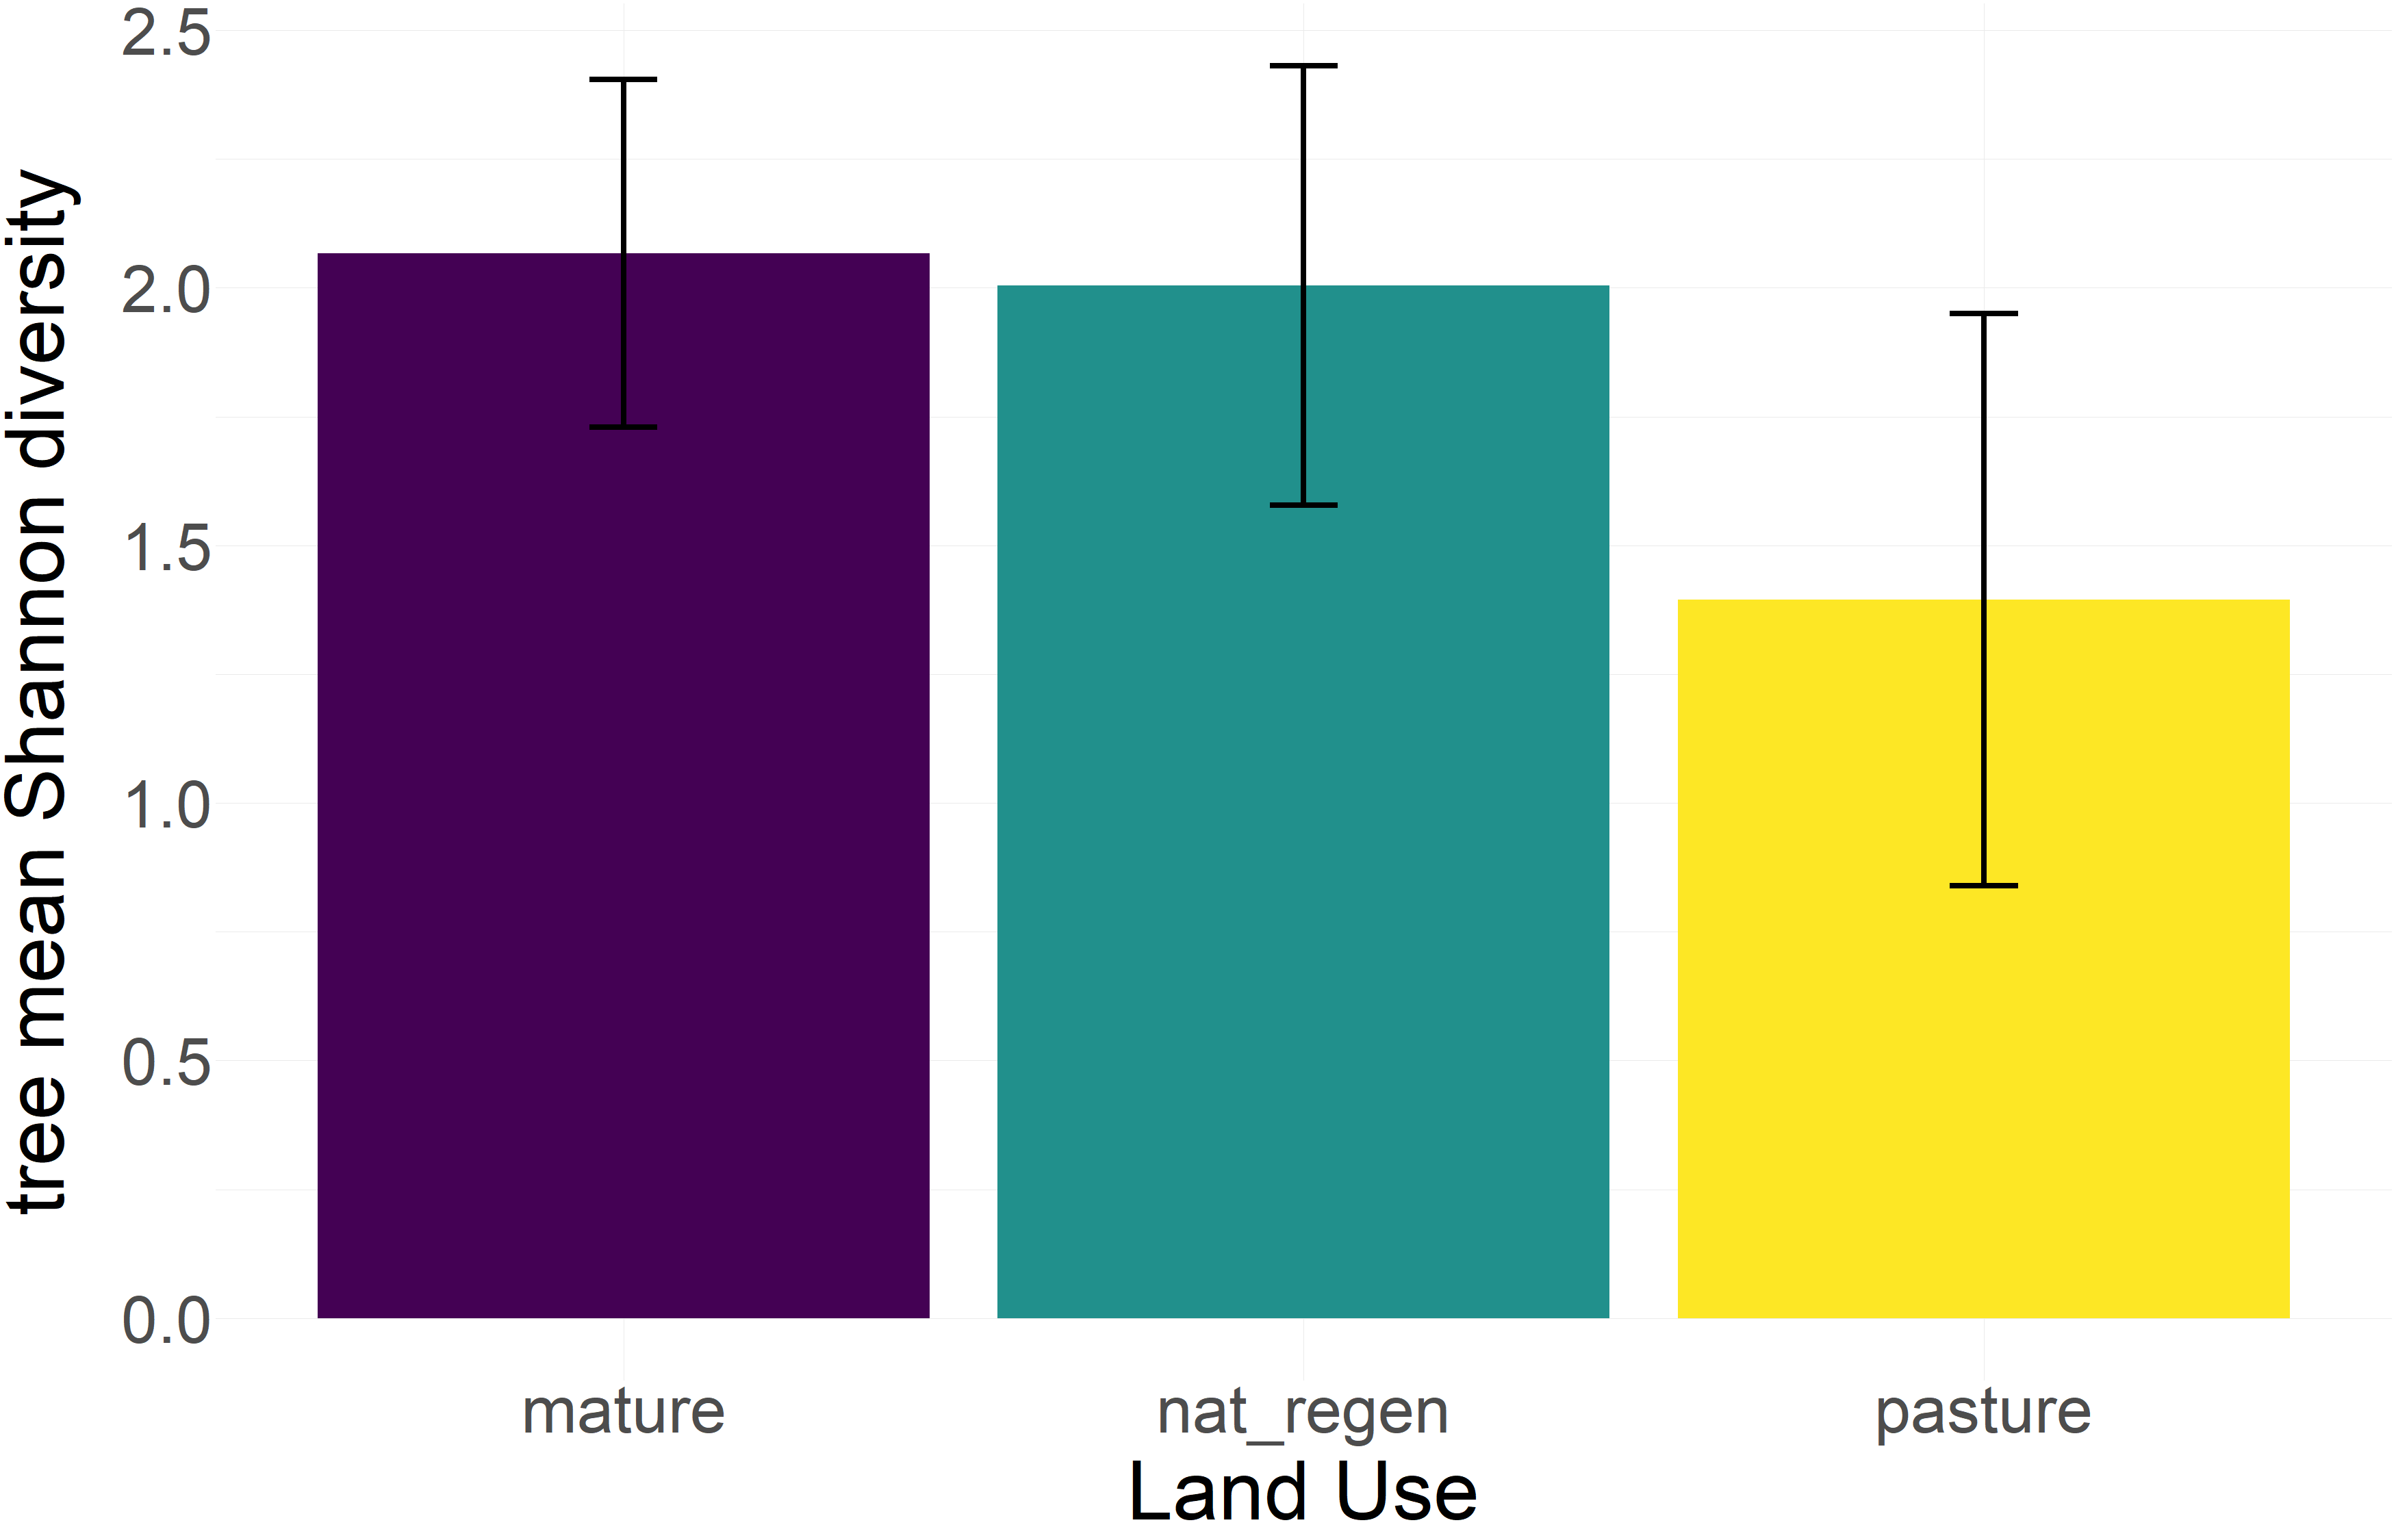
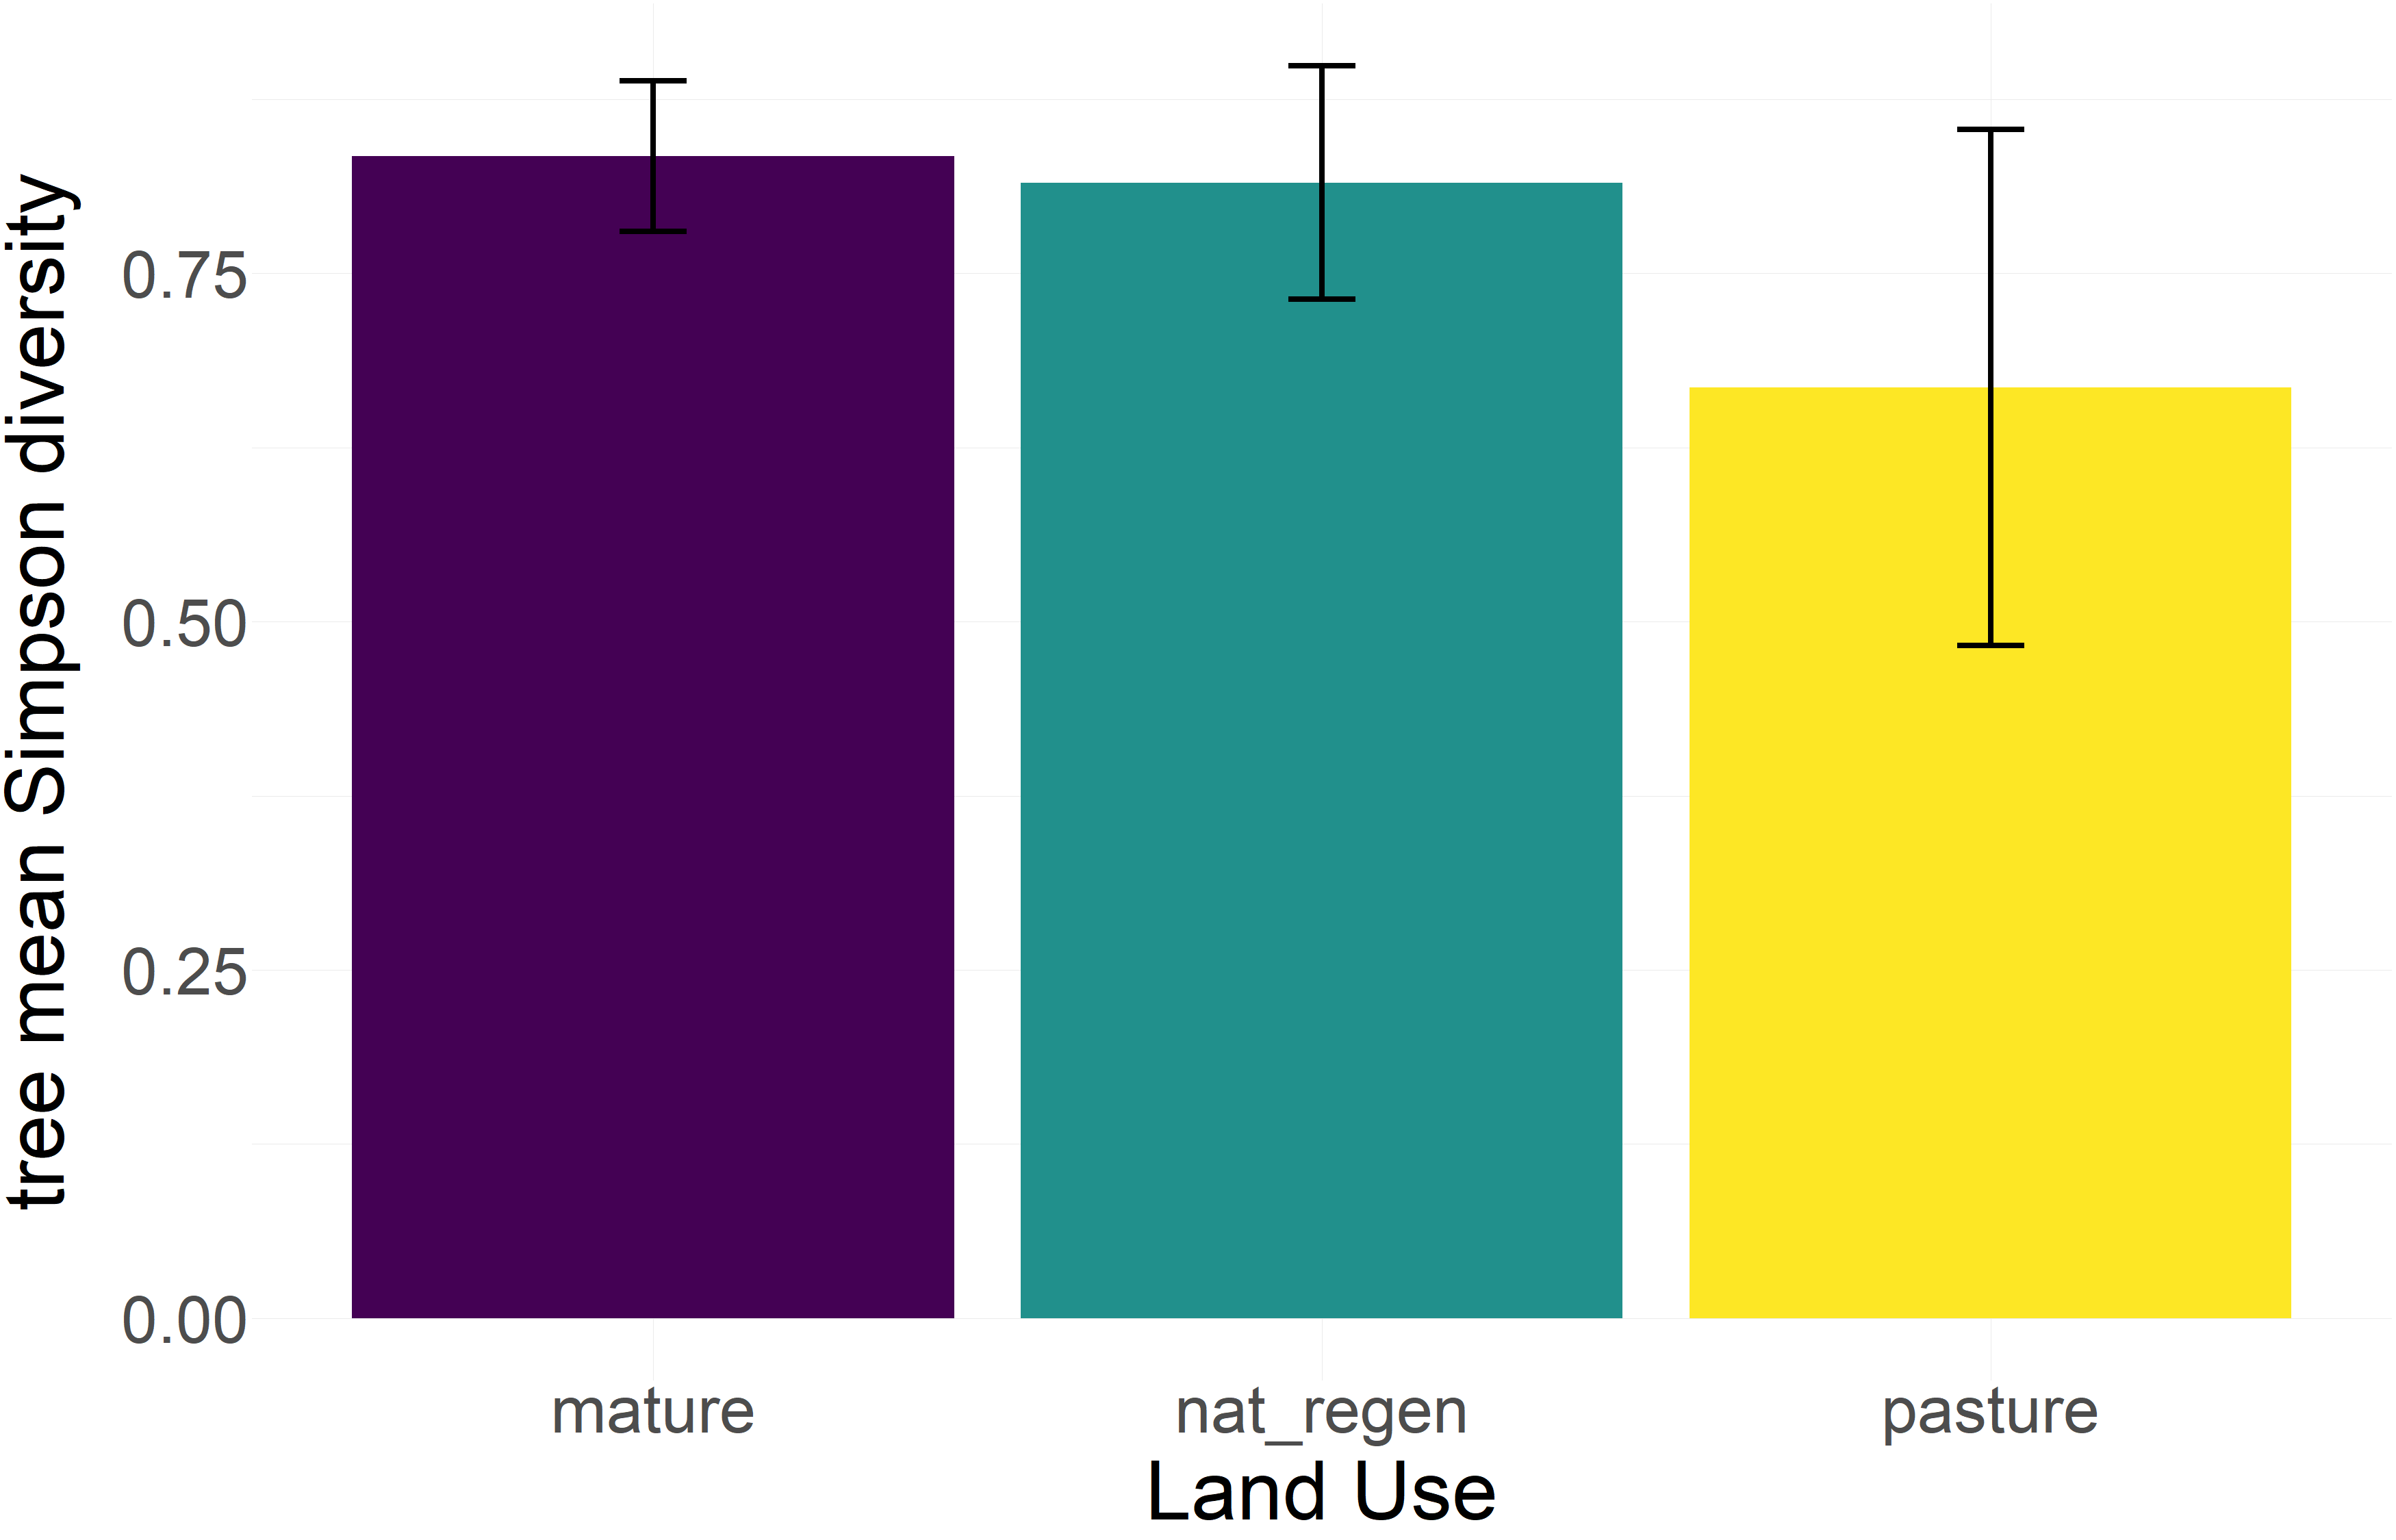
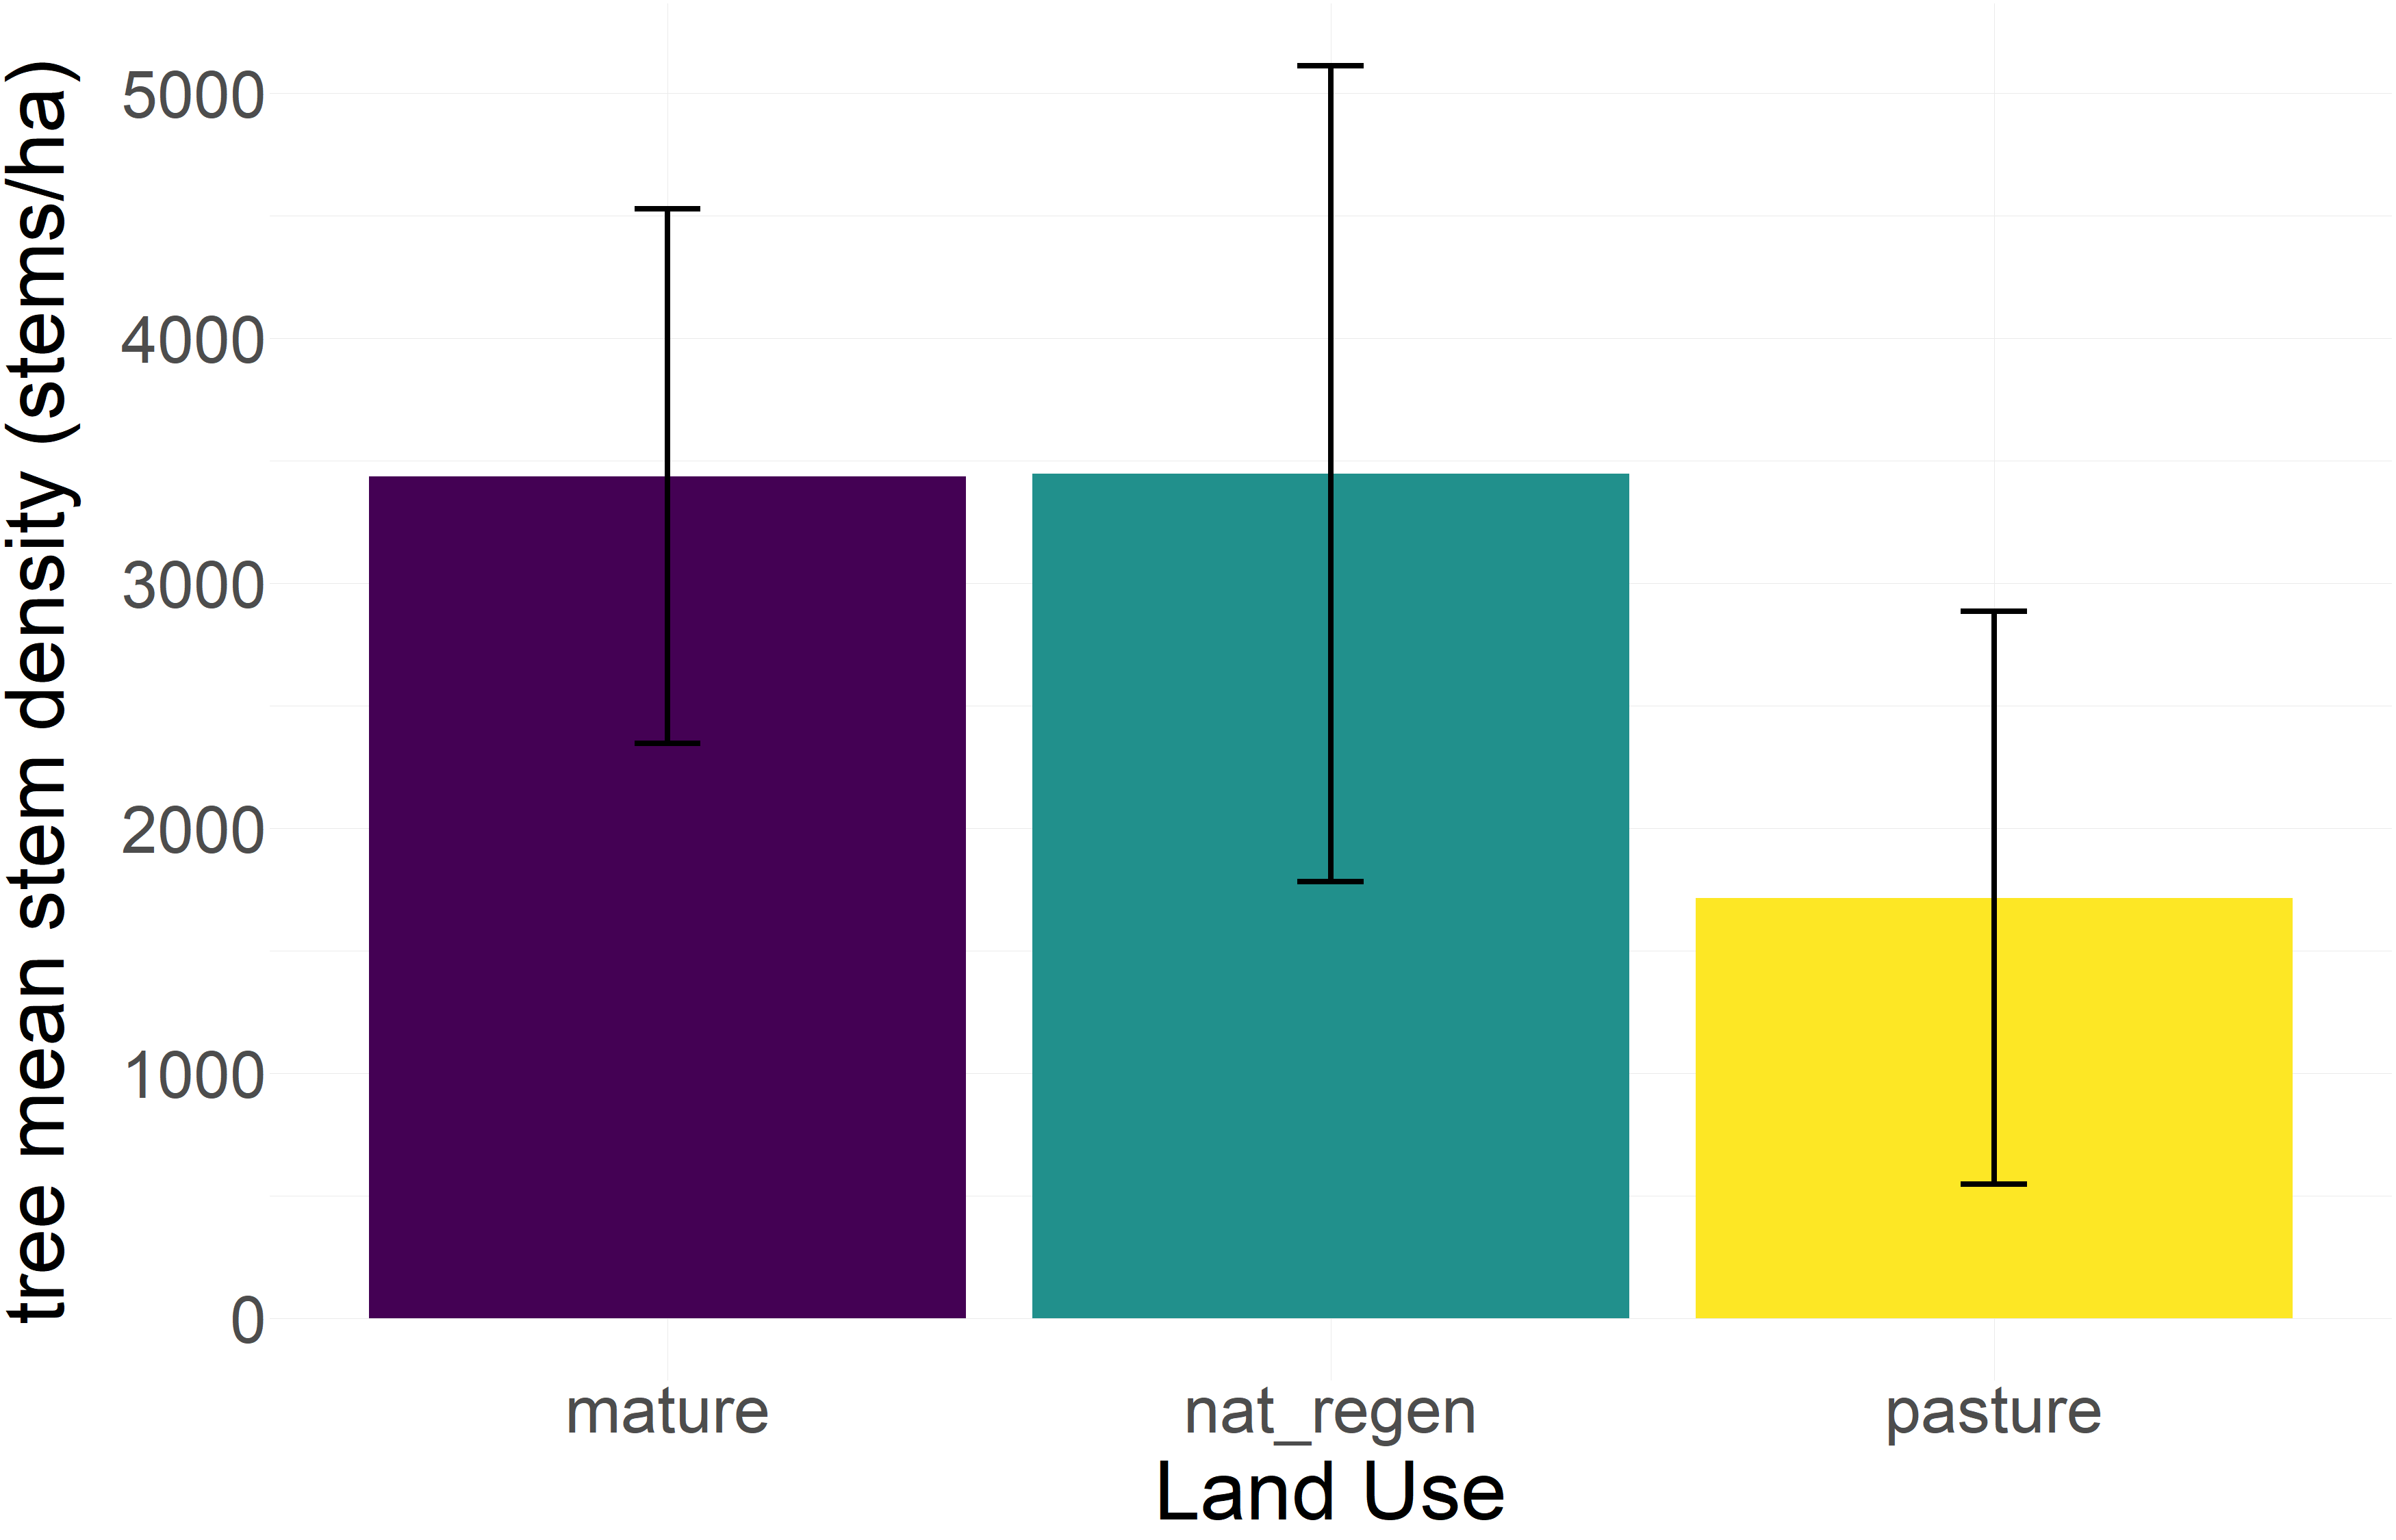
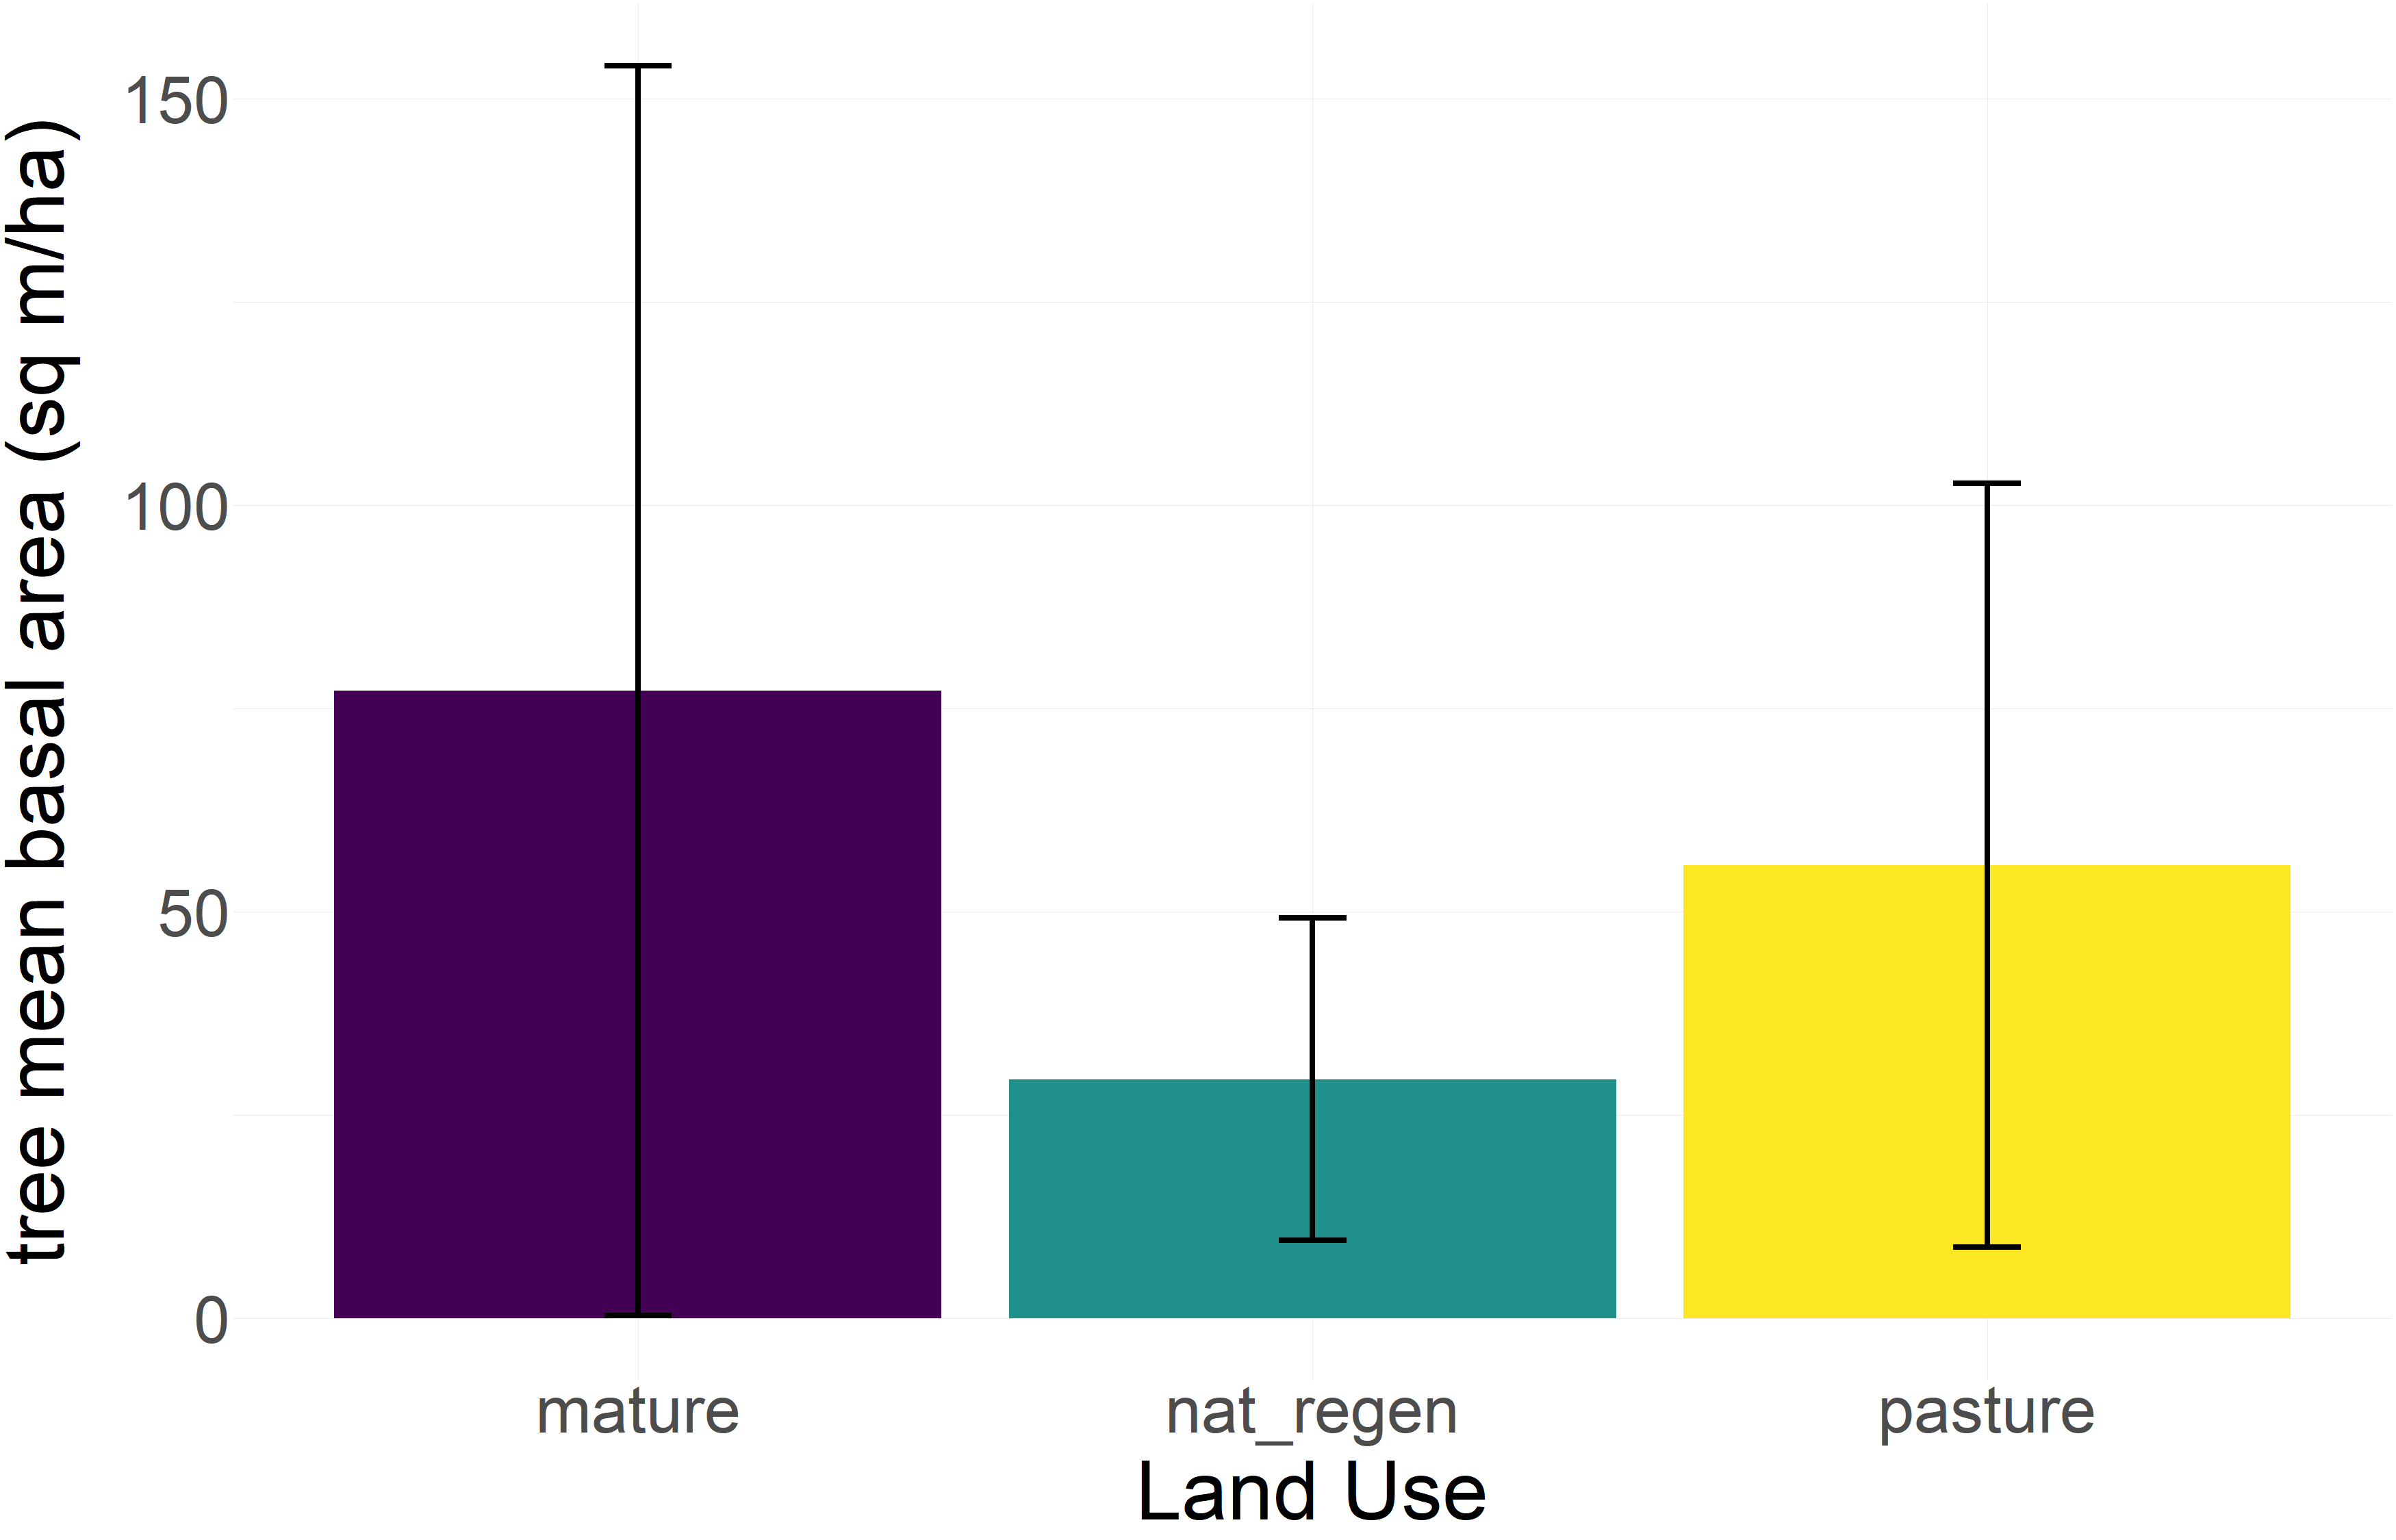
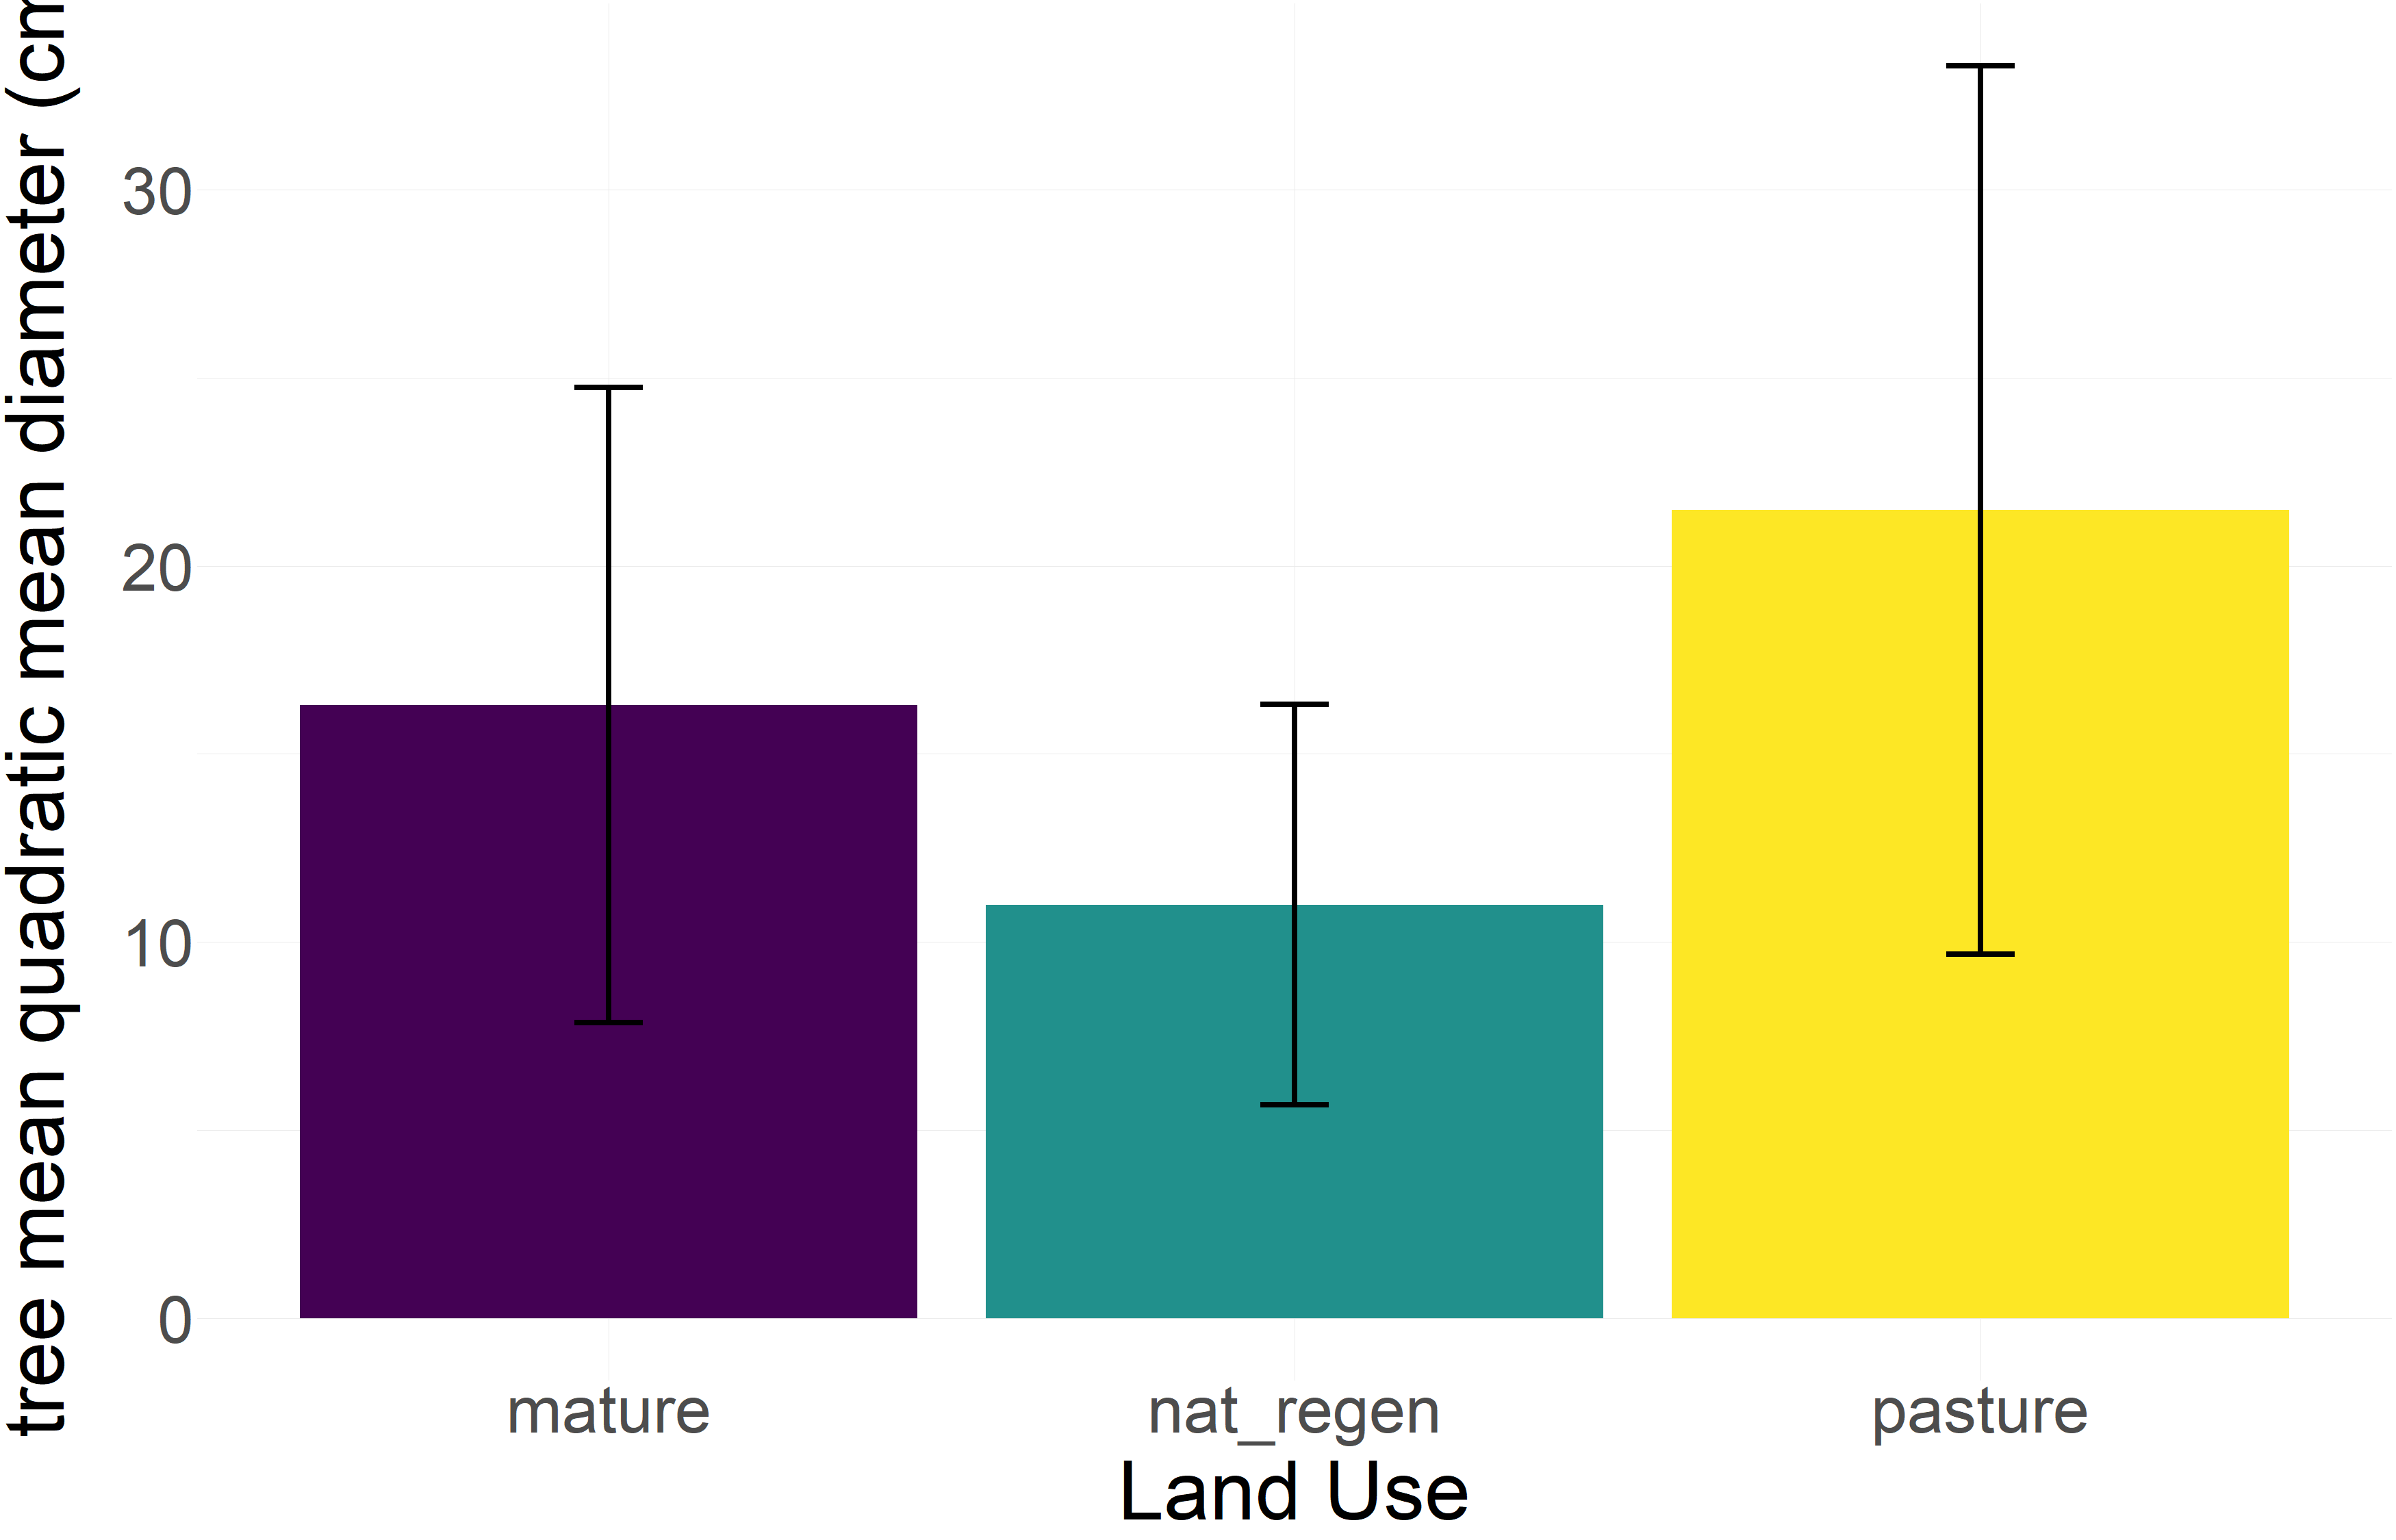
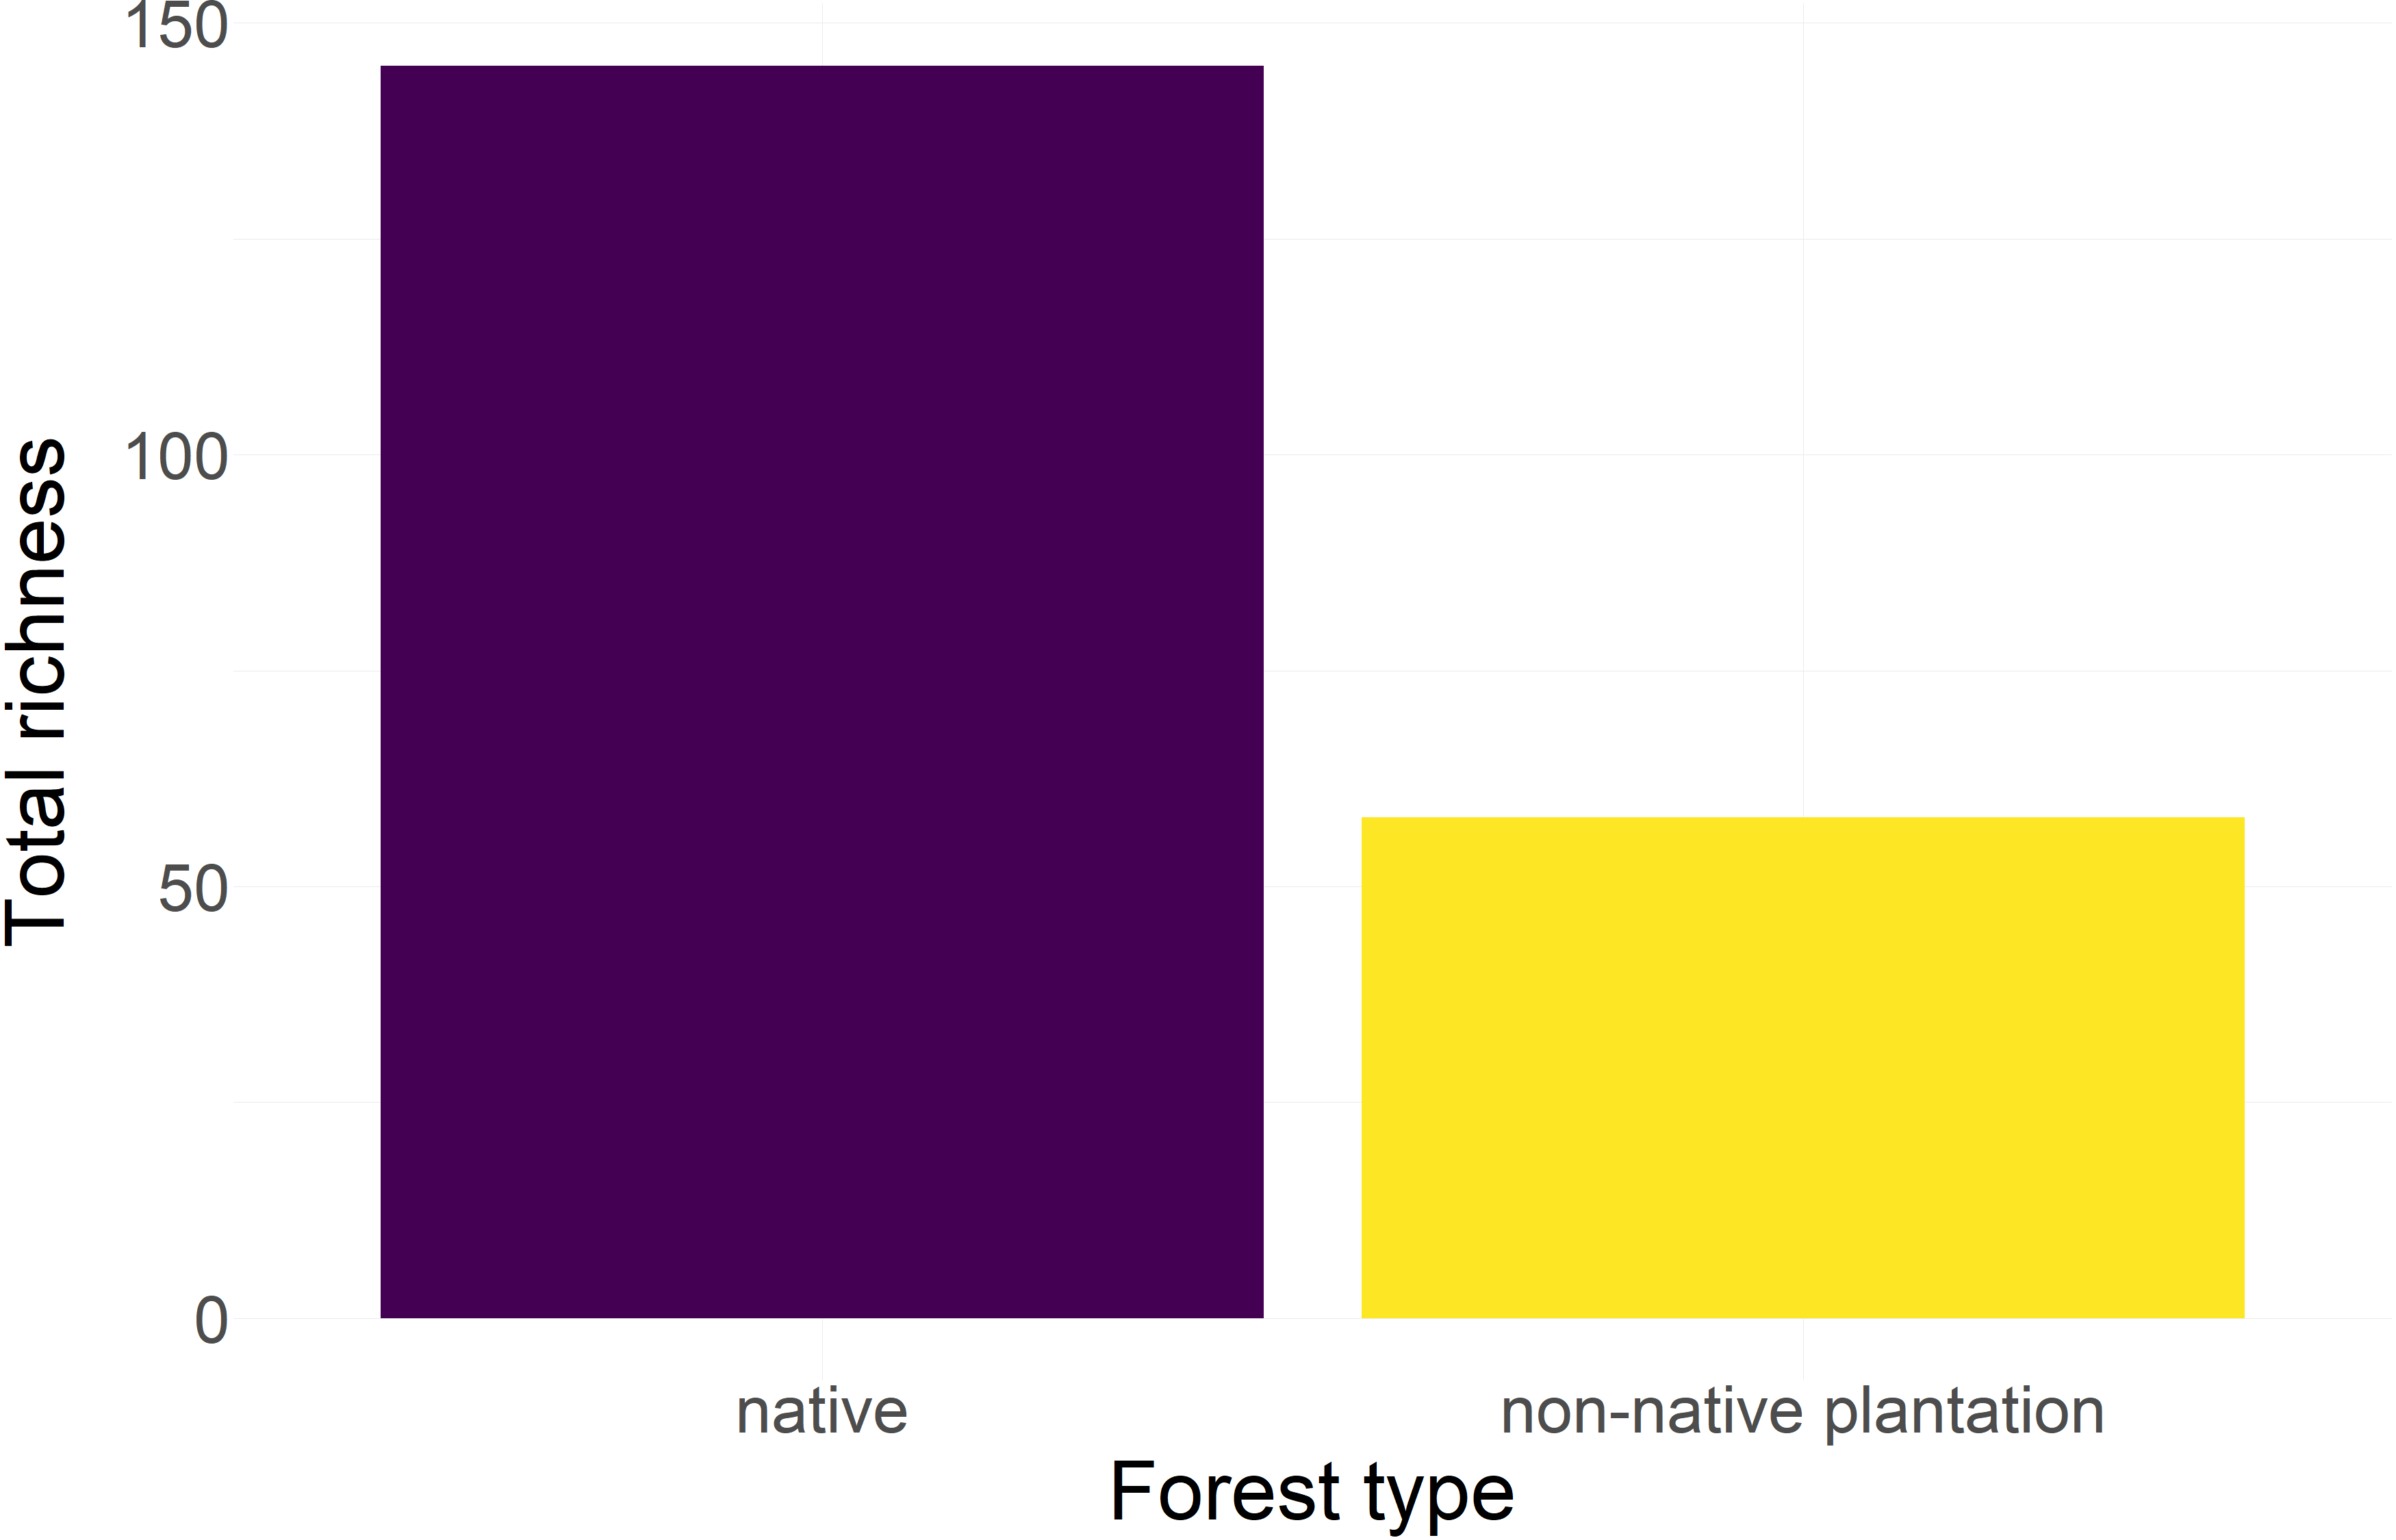
Trees
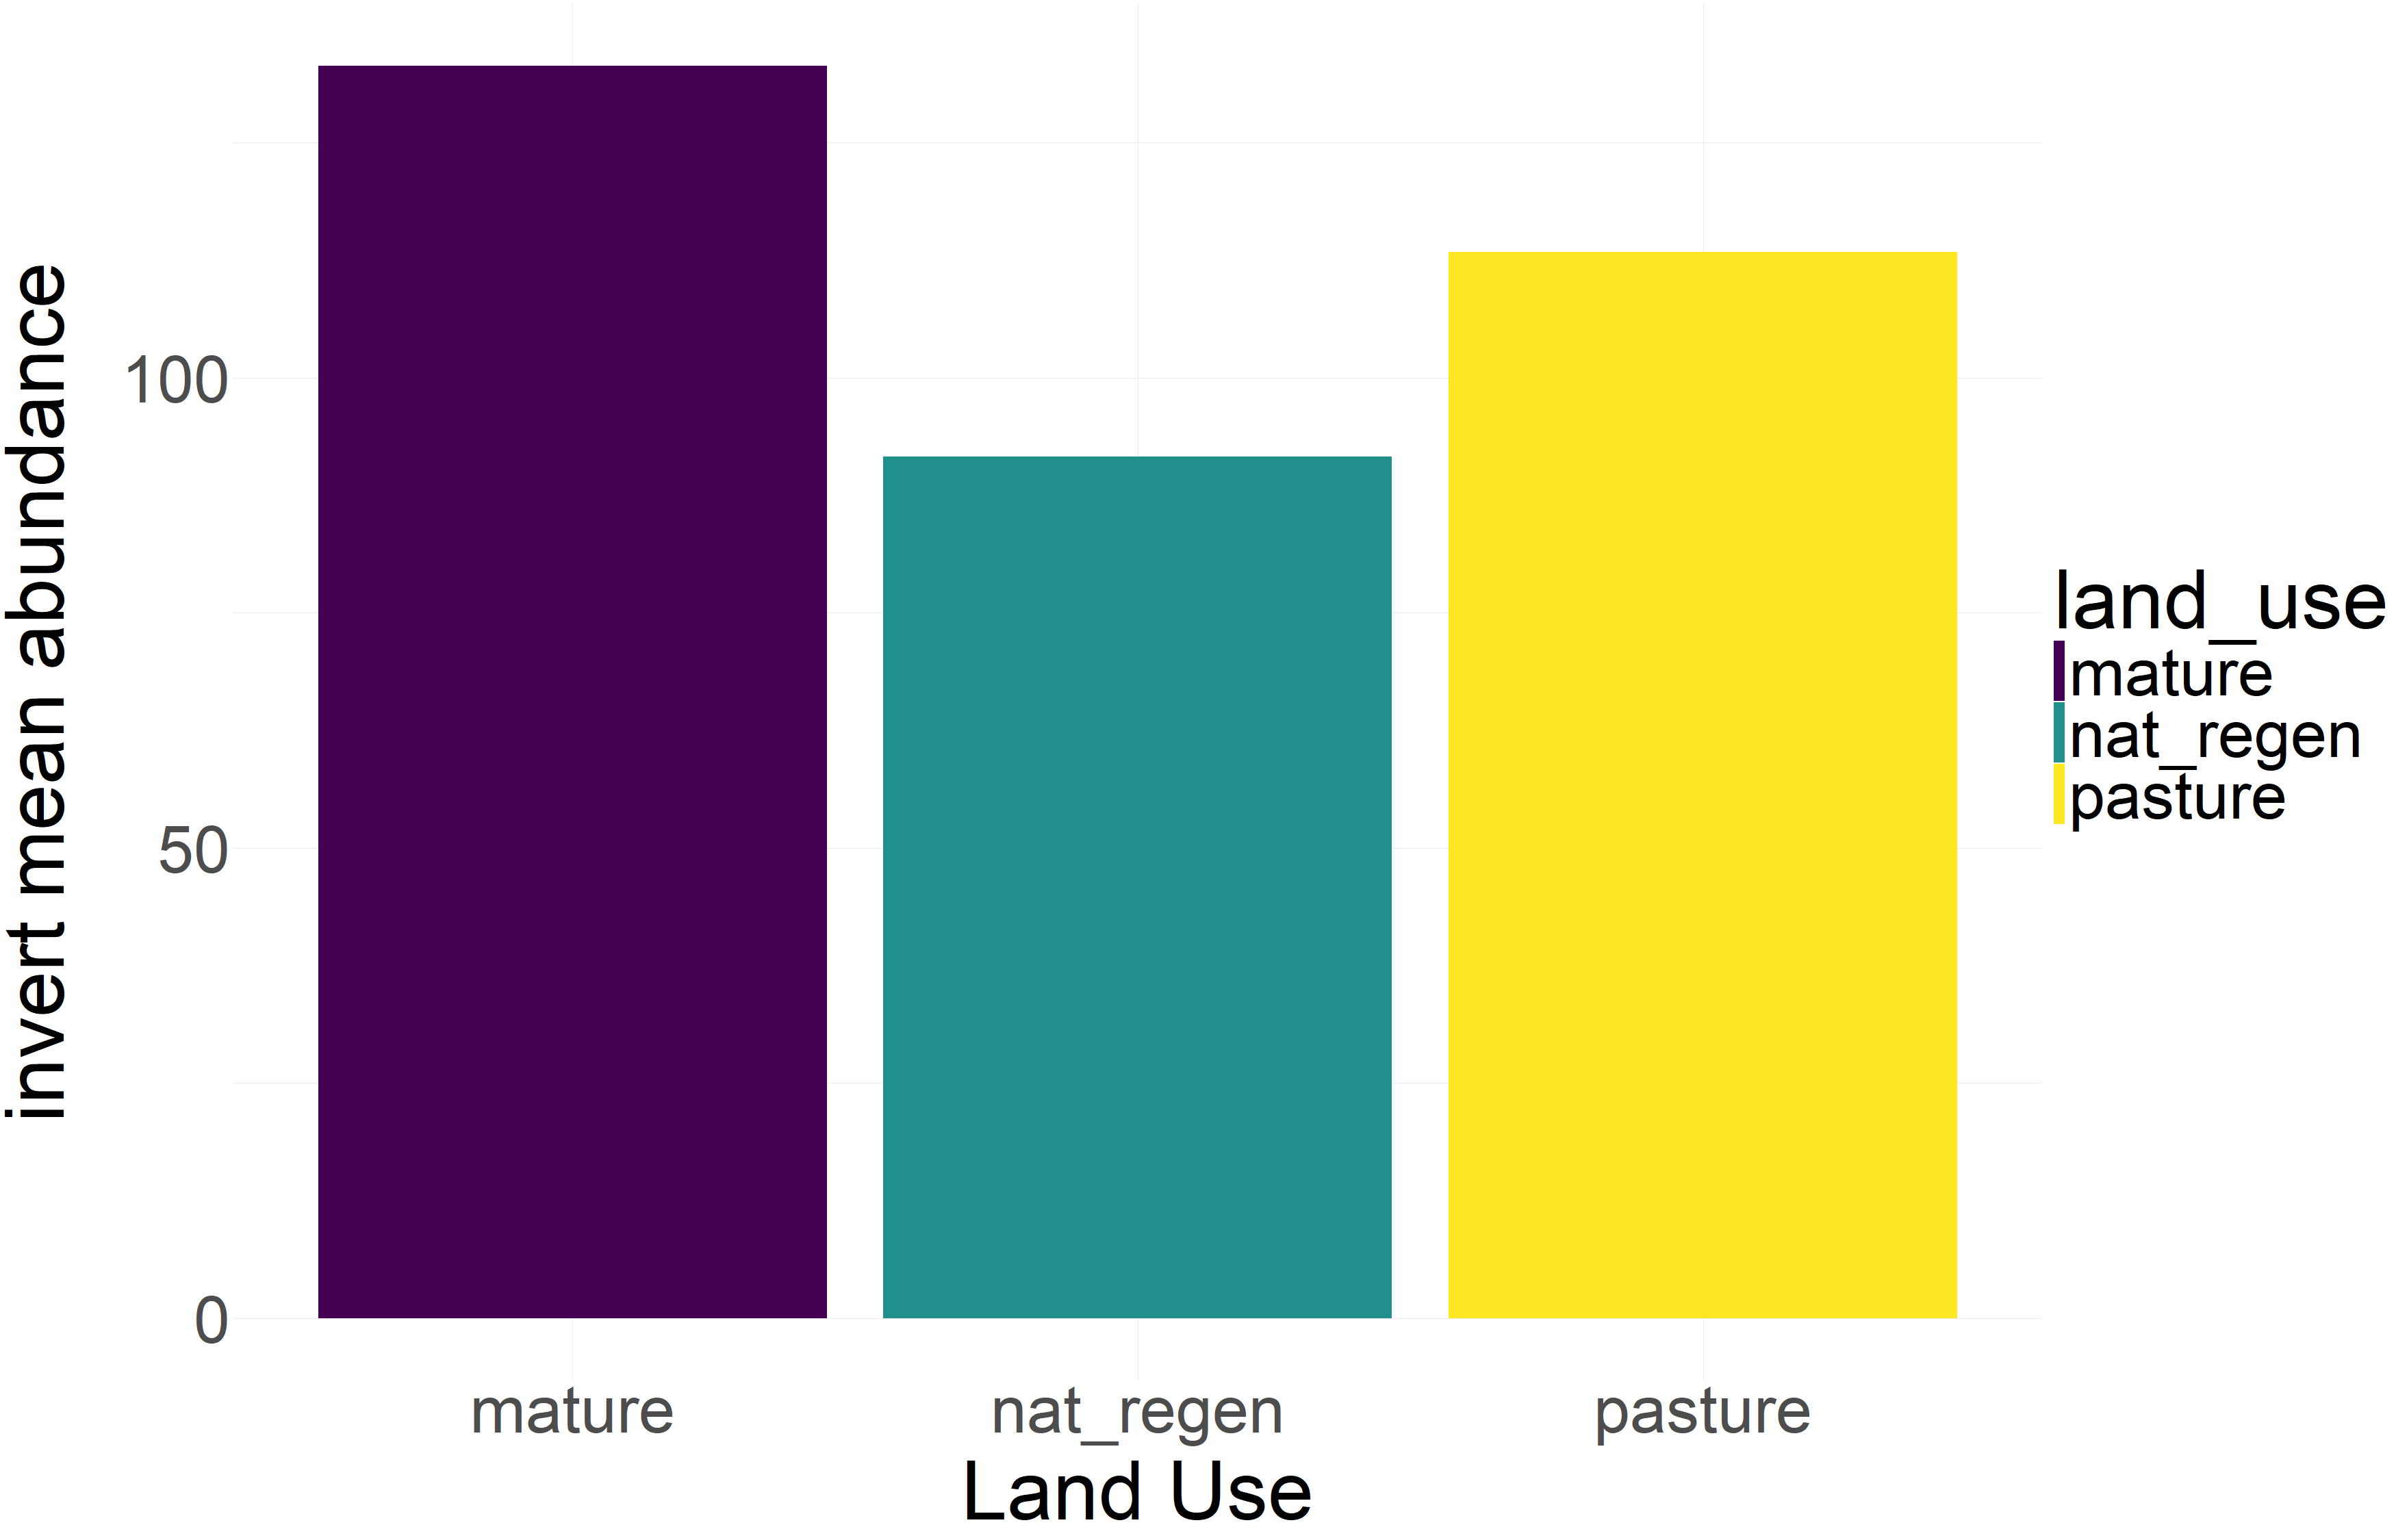
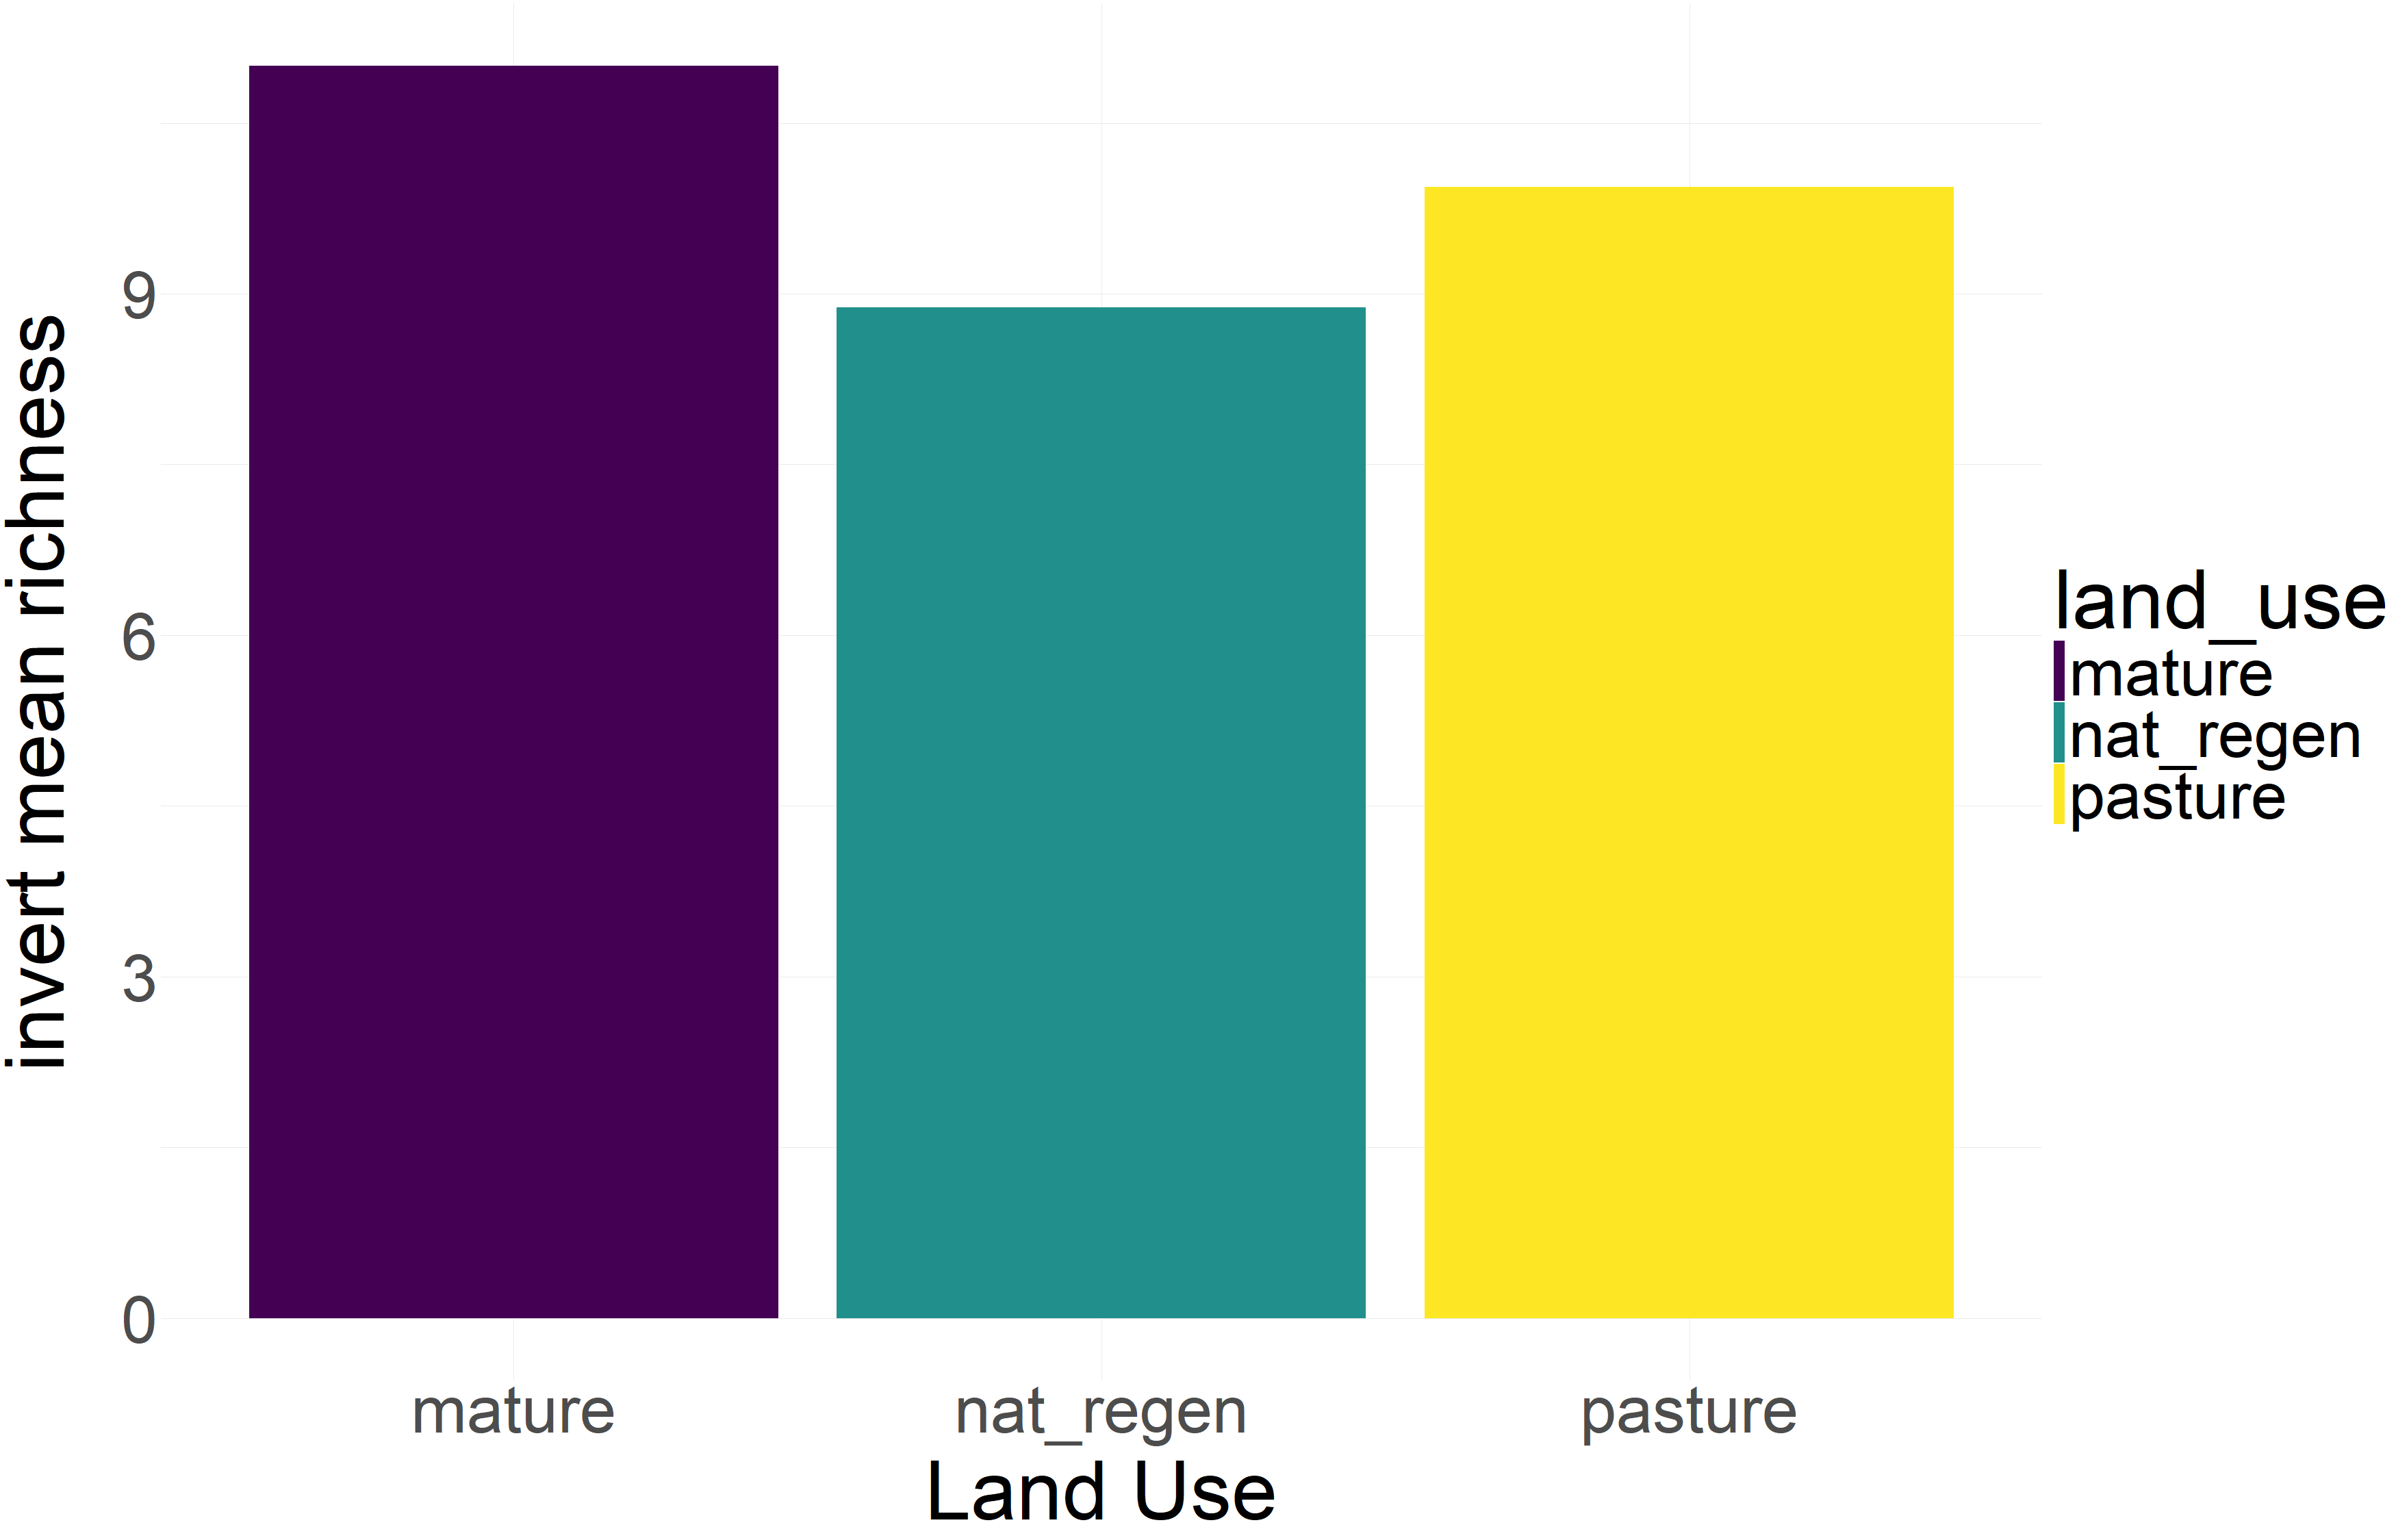
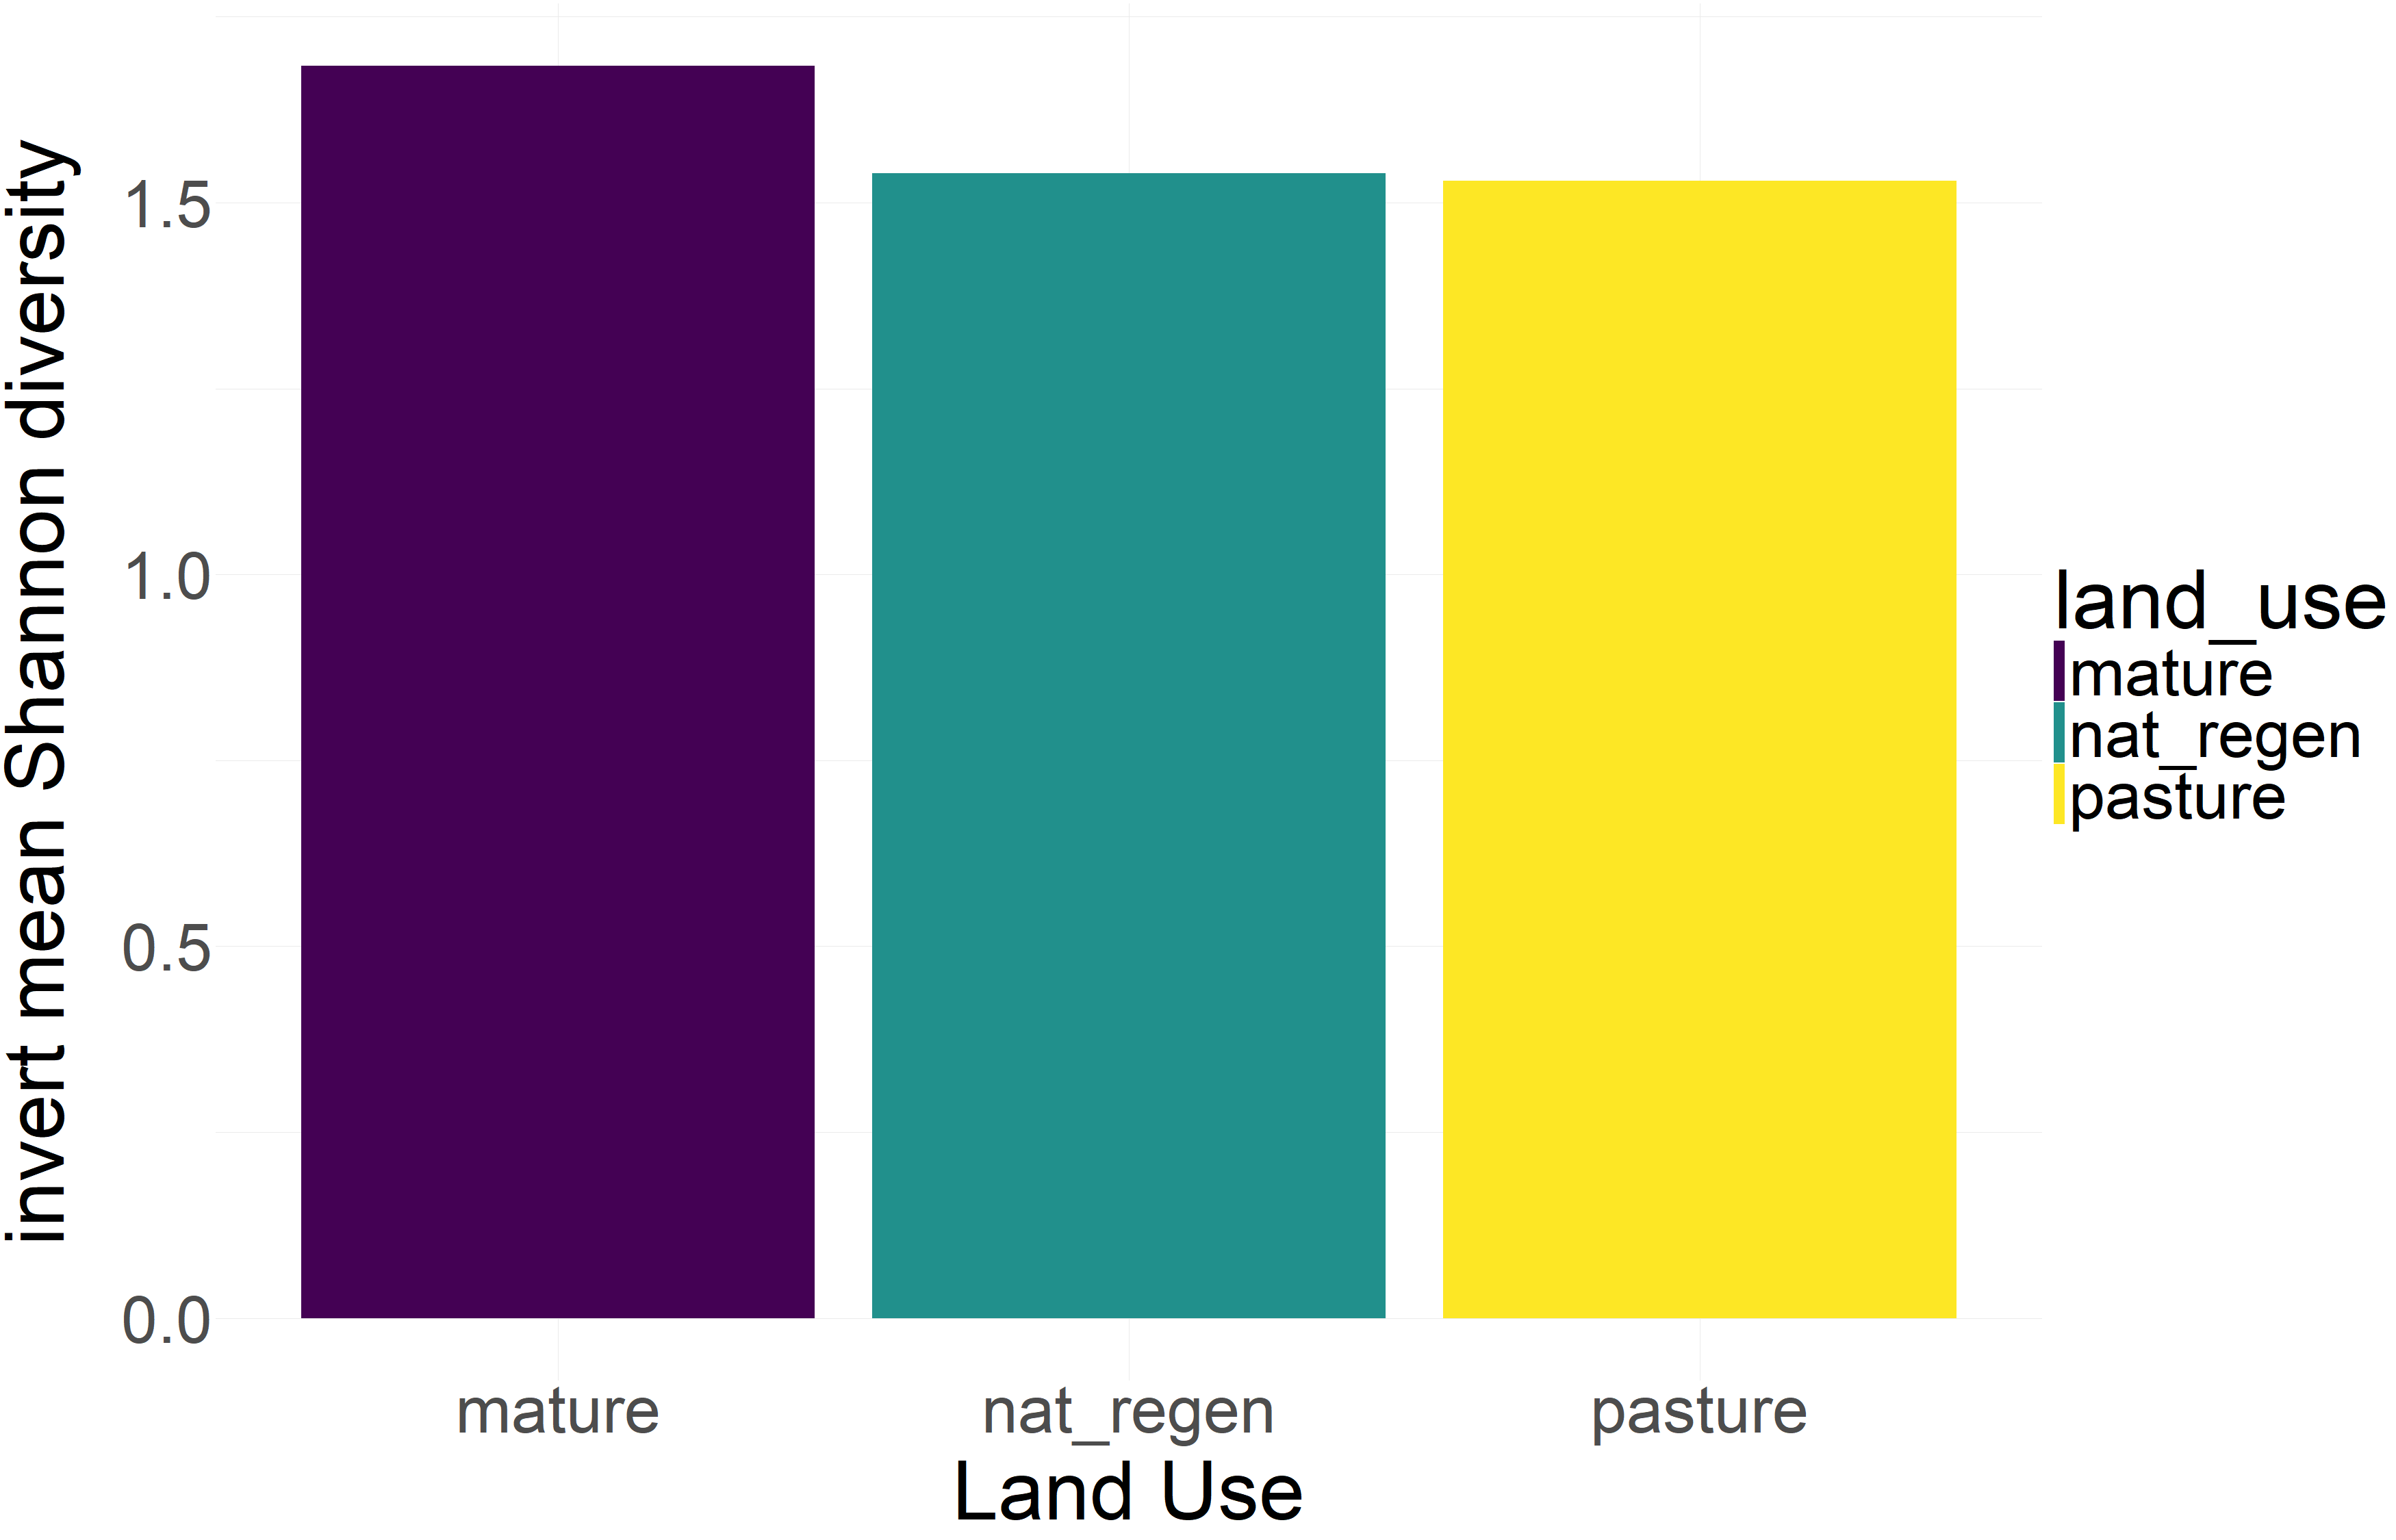
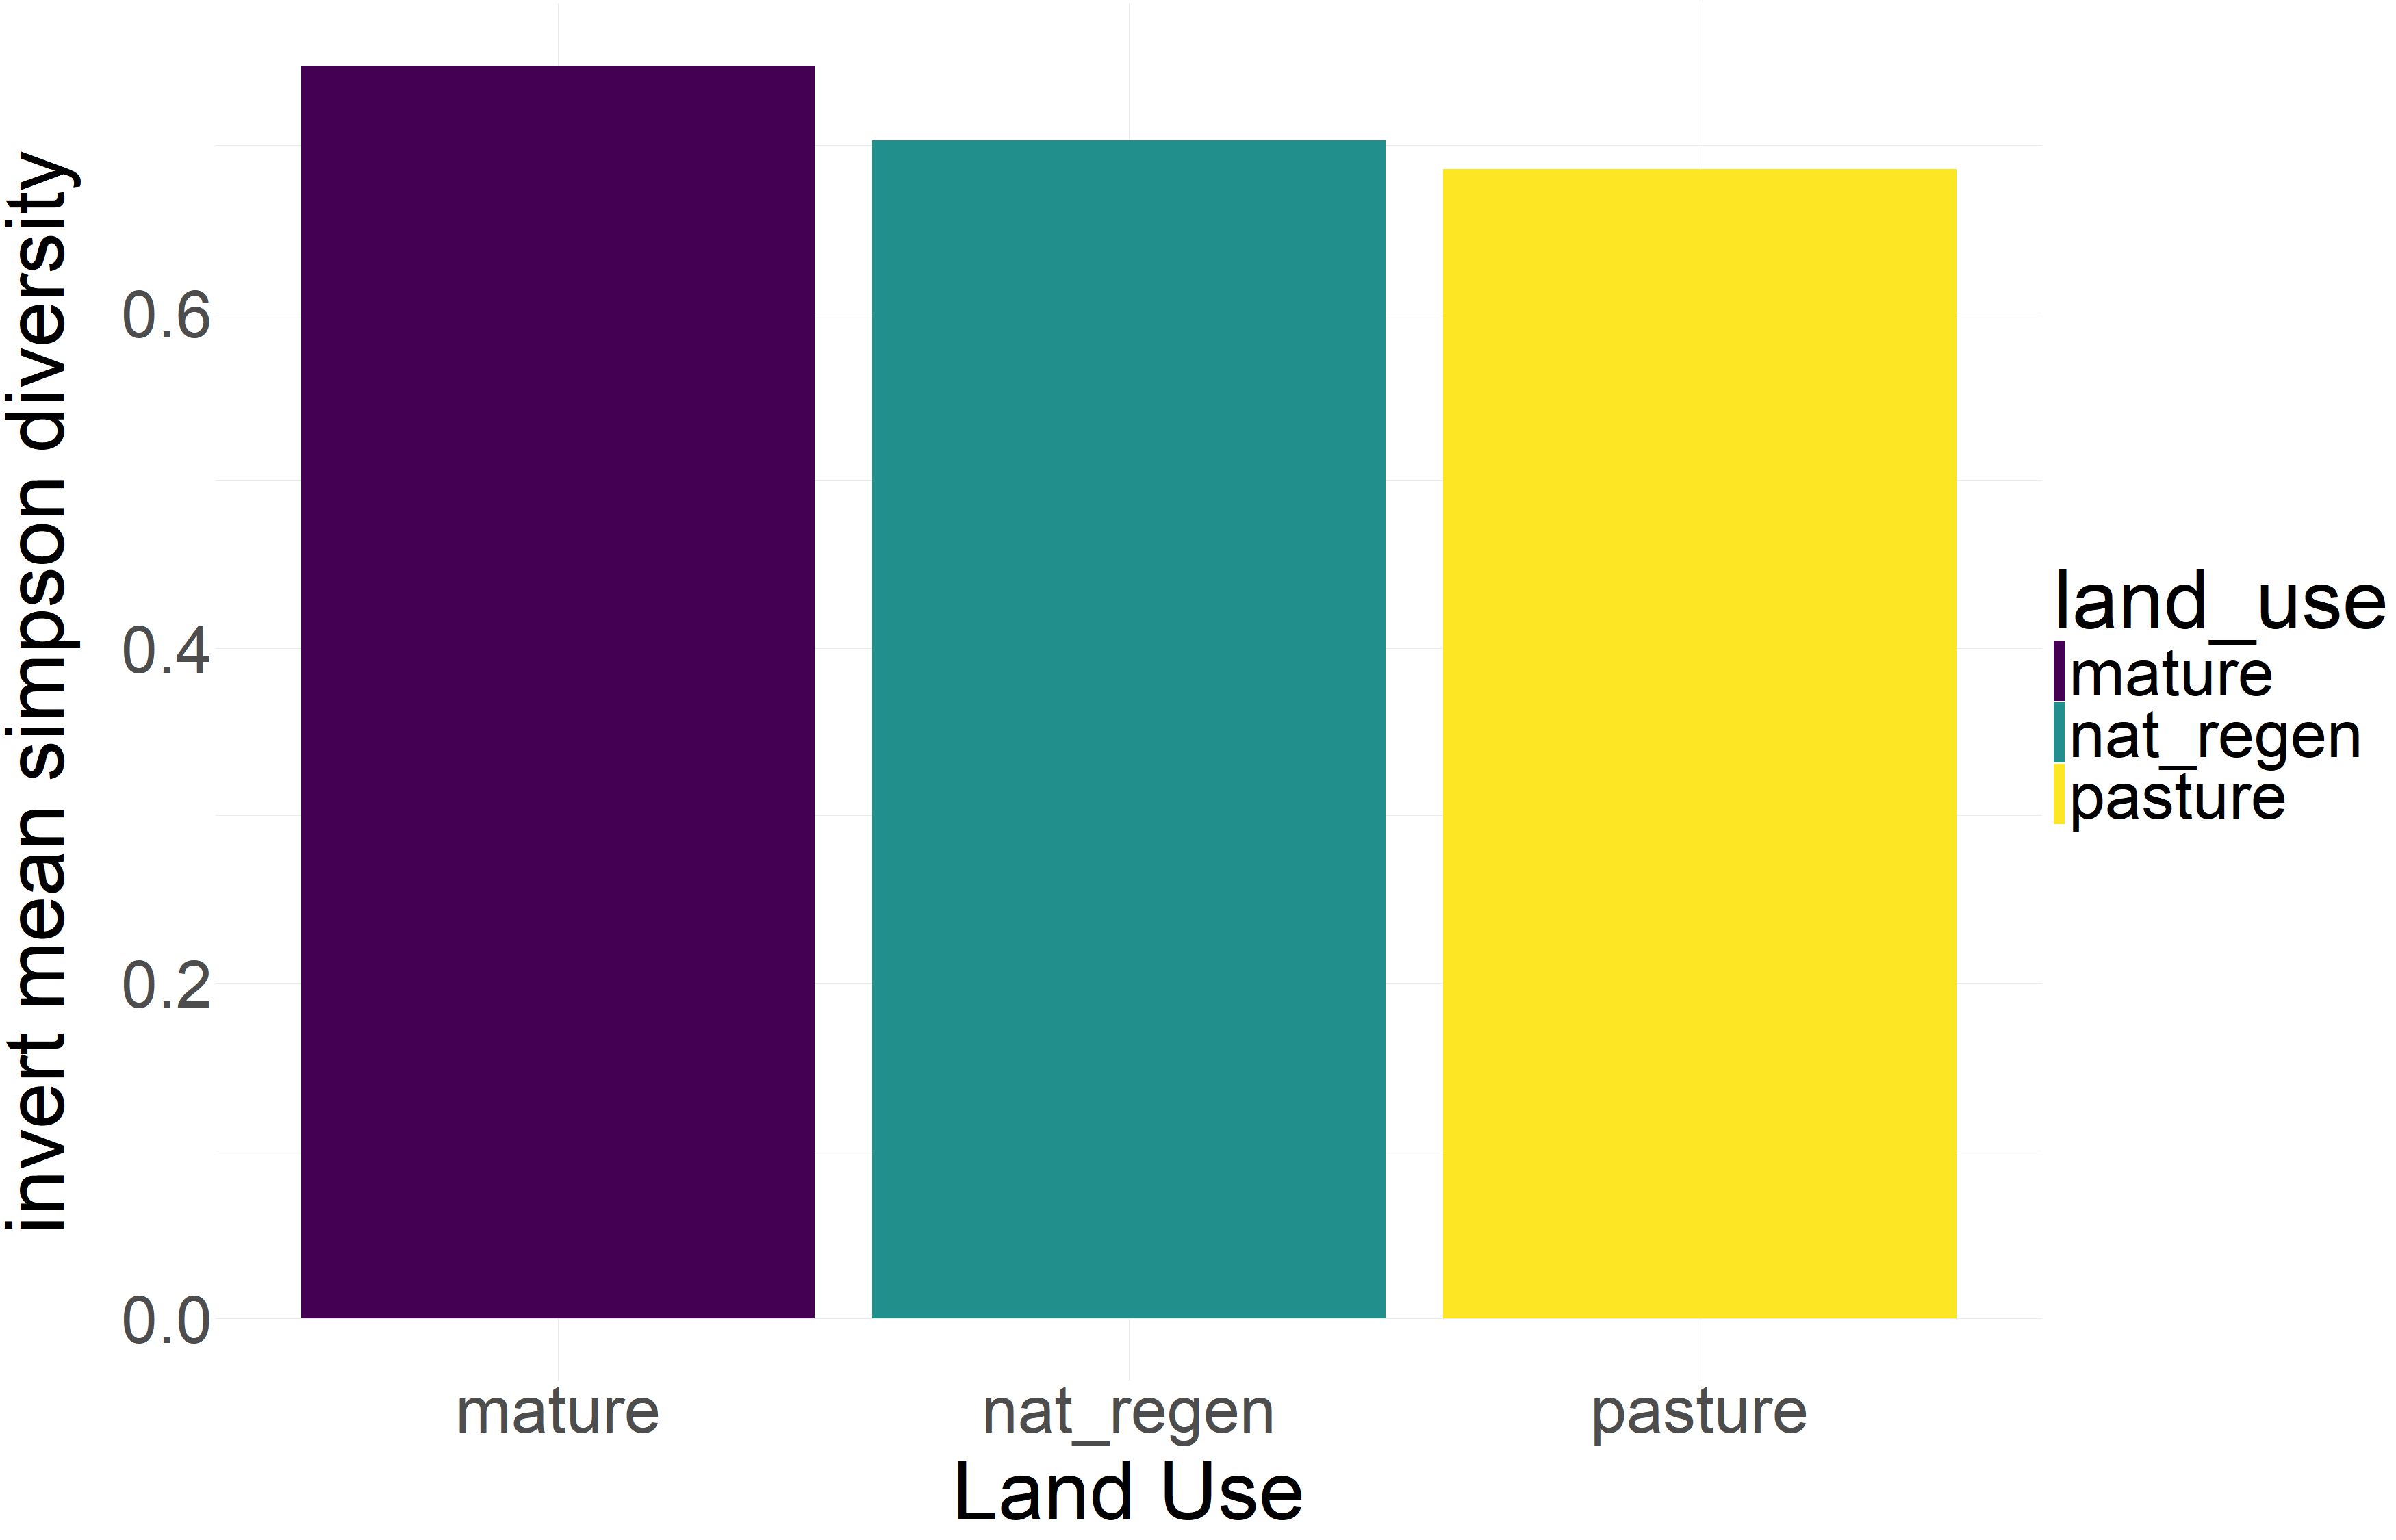
Soil Invertebrates
Mothbox
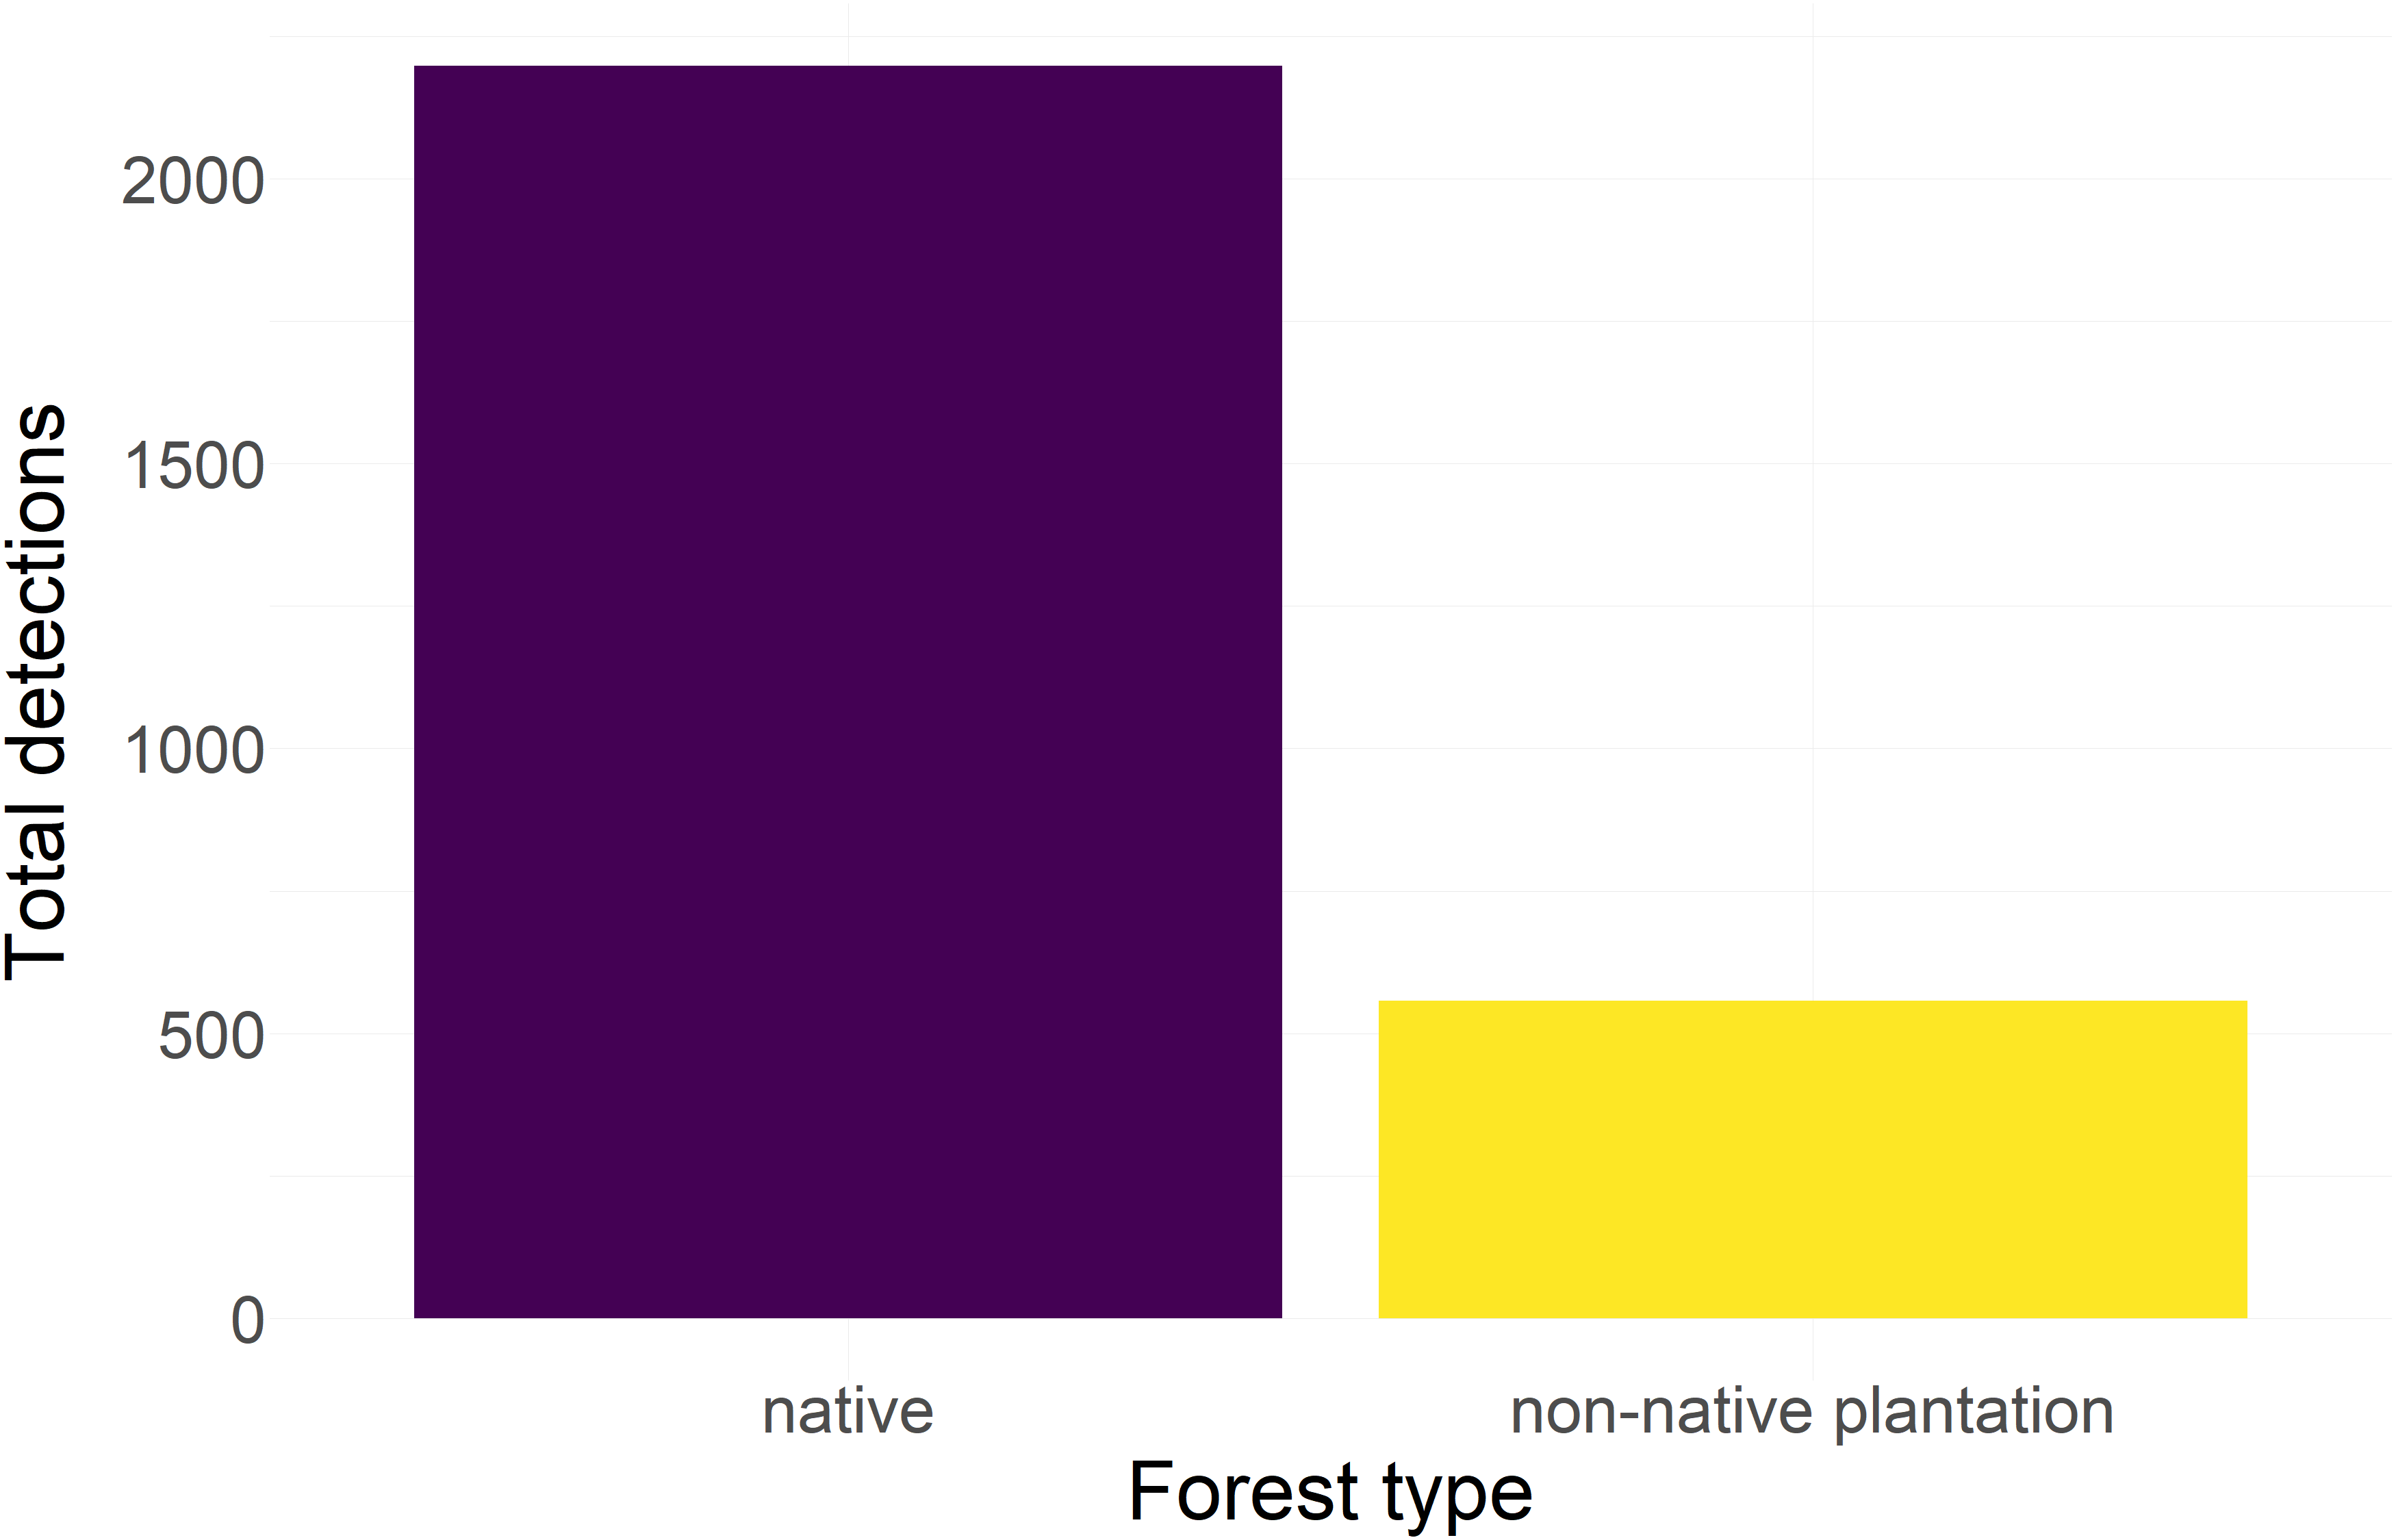
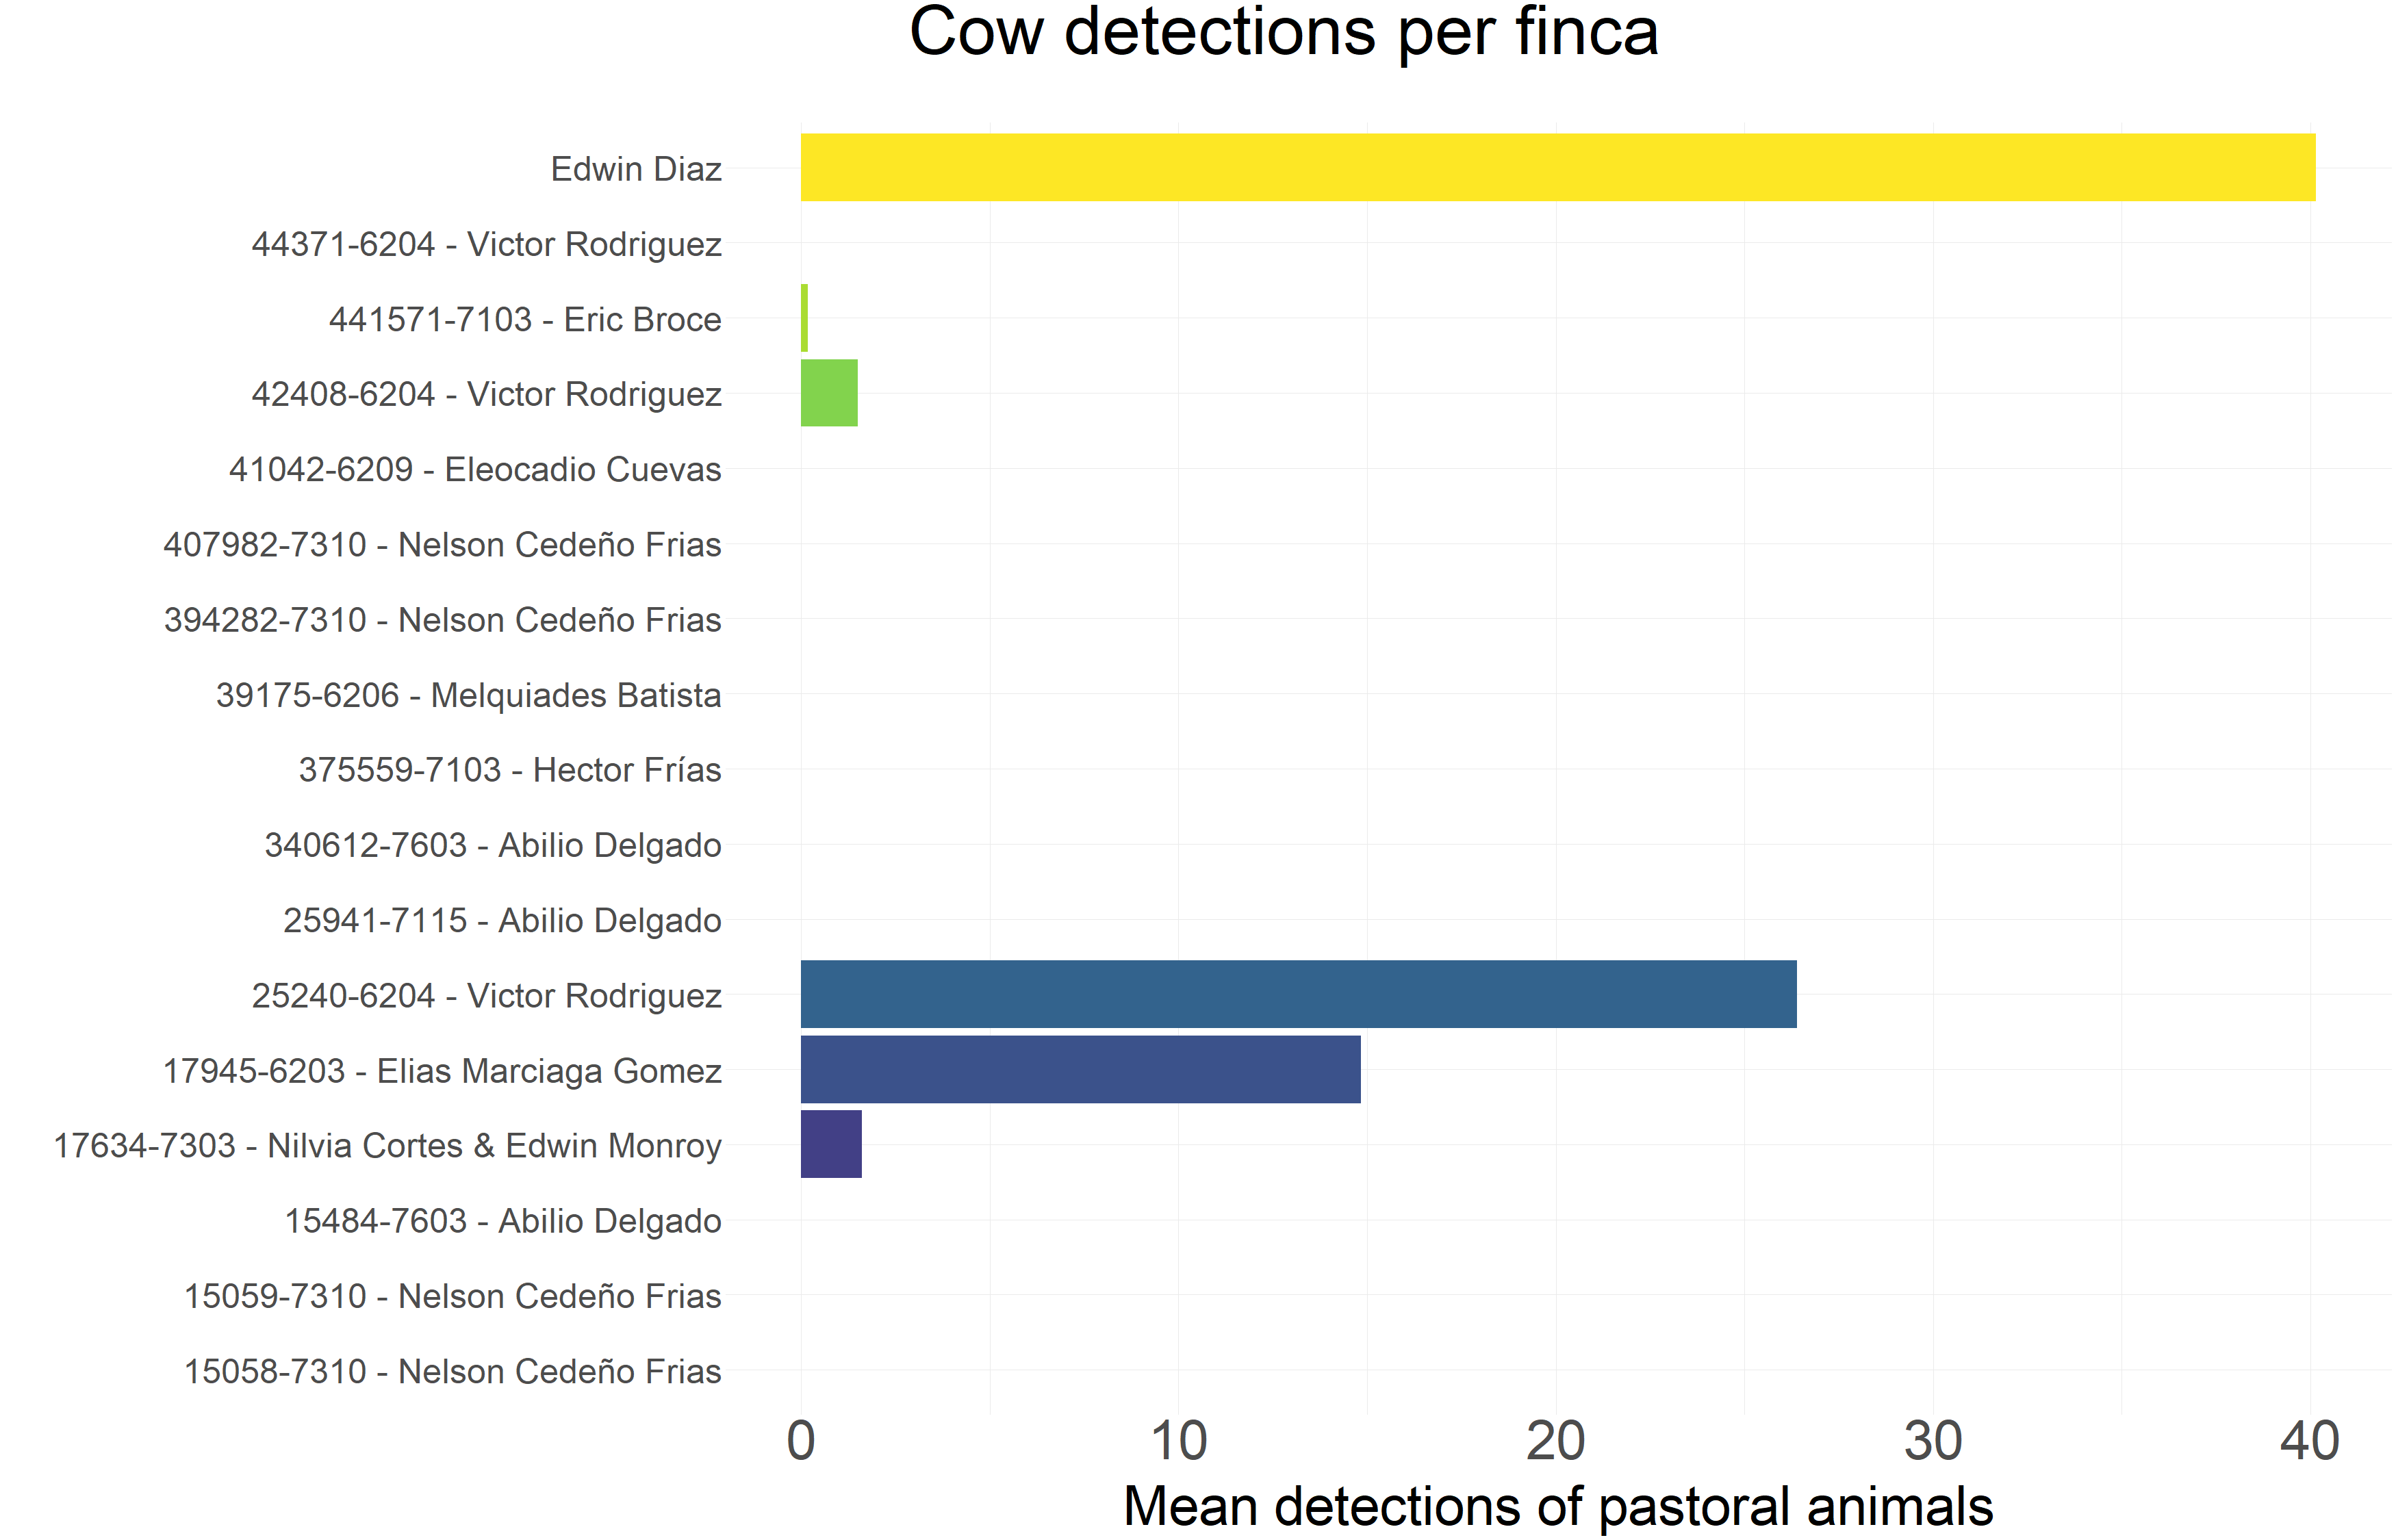
Cow detections
Made this figure to Help Ponterra conceptualize landowner non-compliance with contracts (which state no cows are allowed into reforested areas)
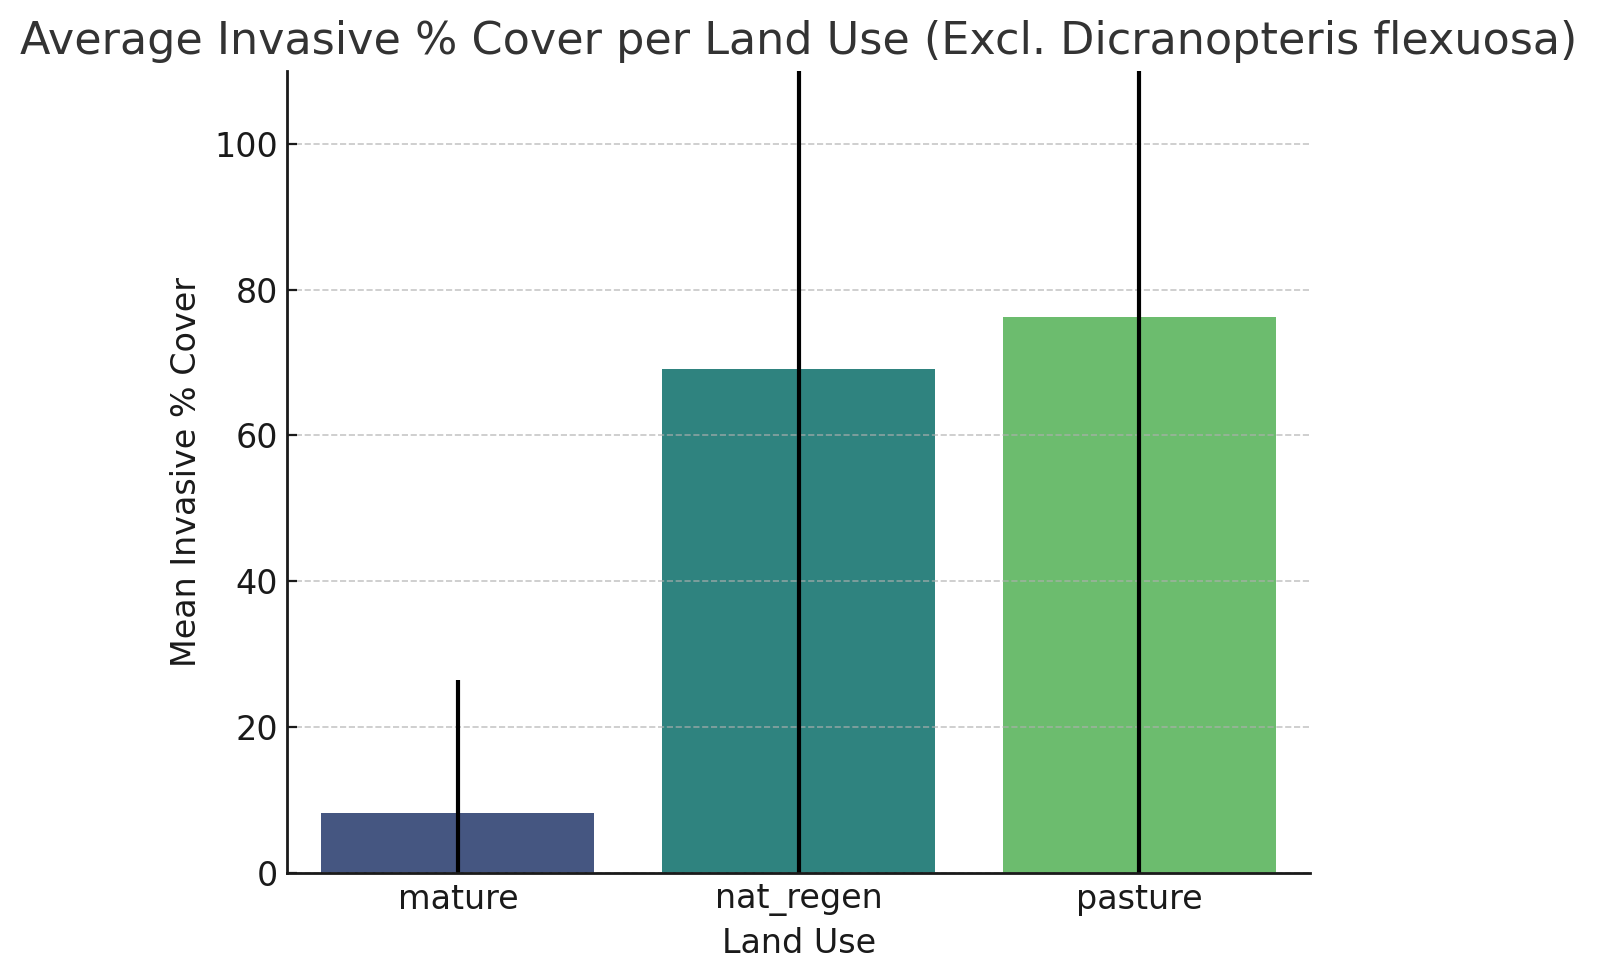
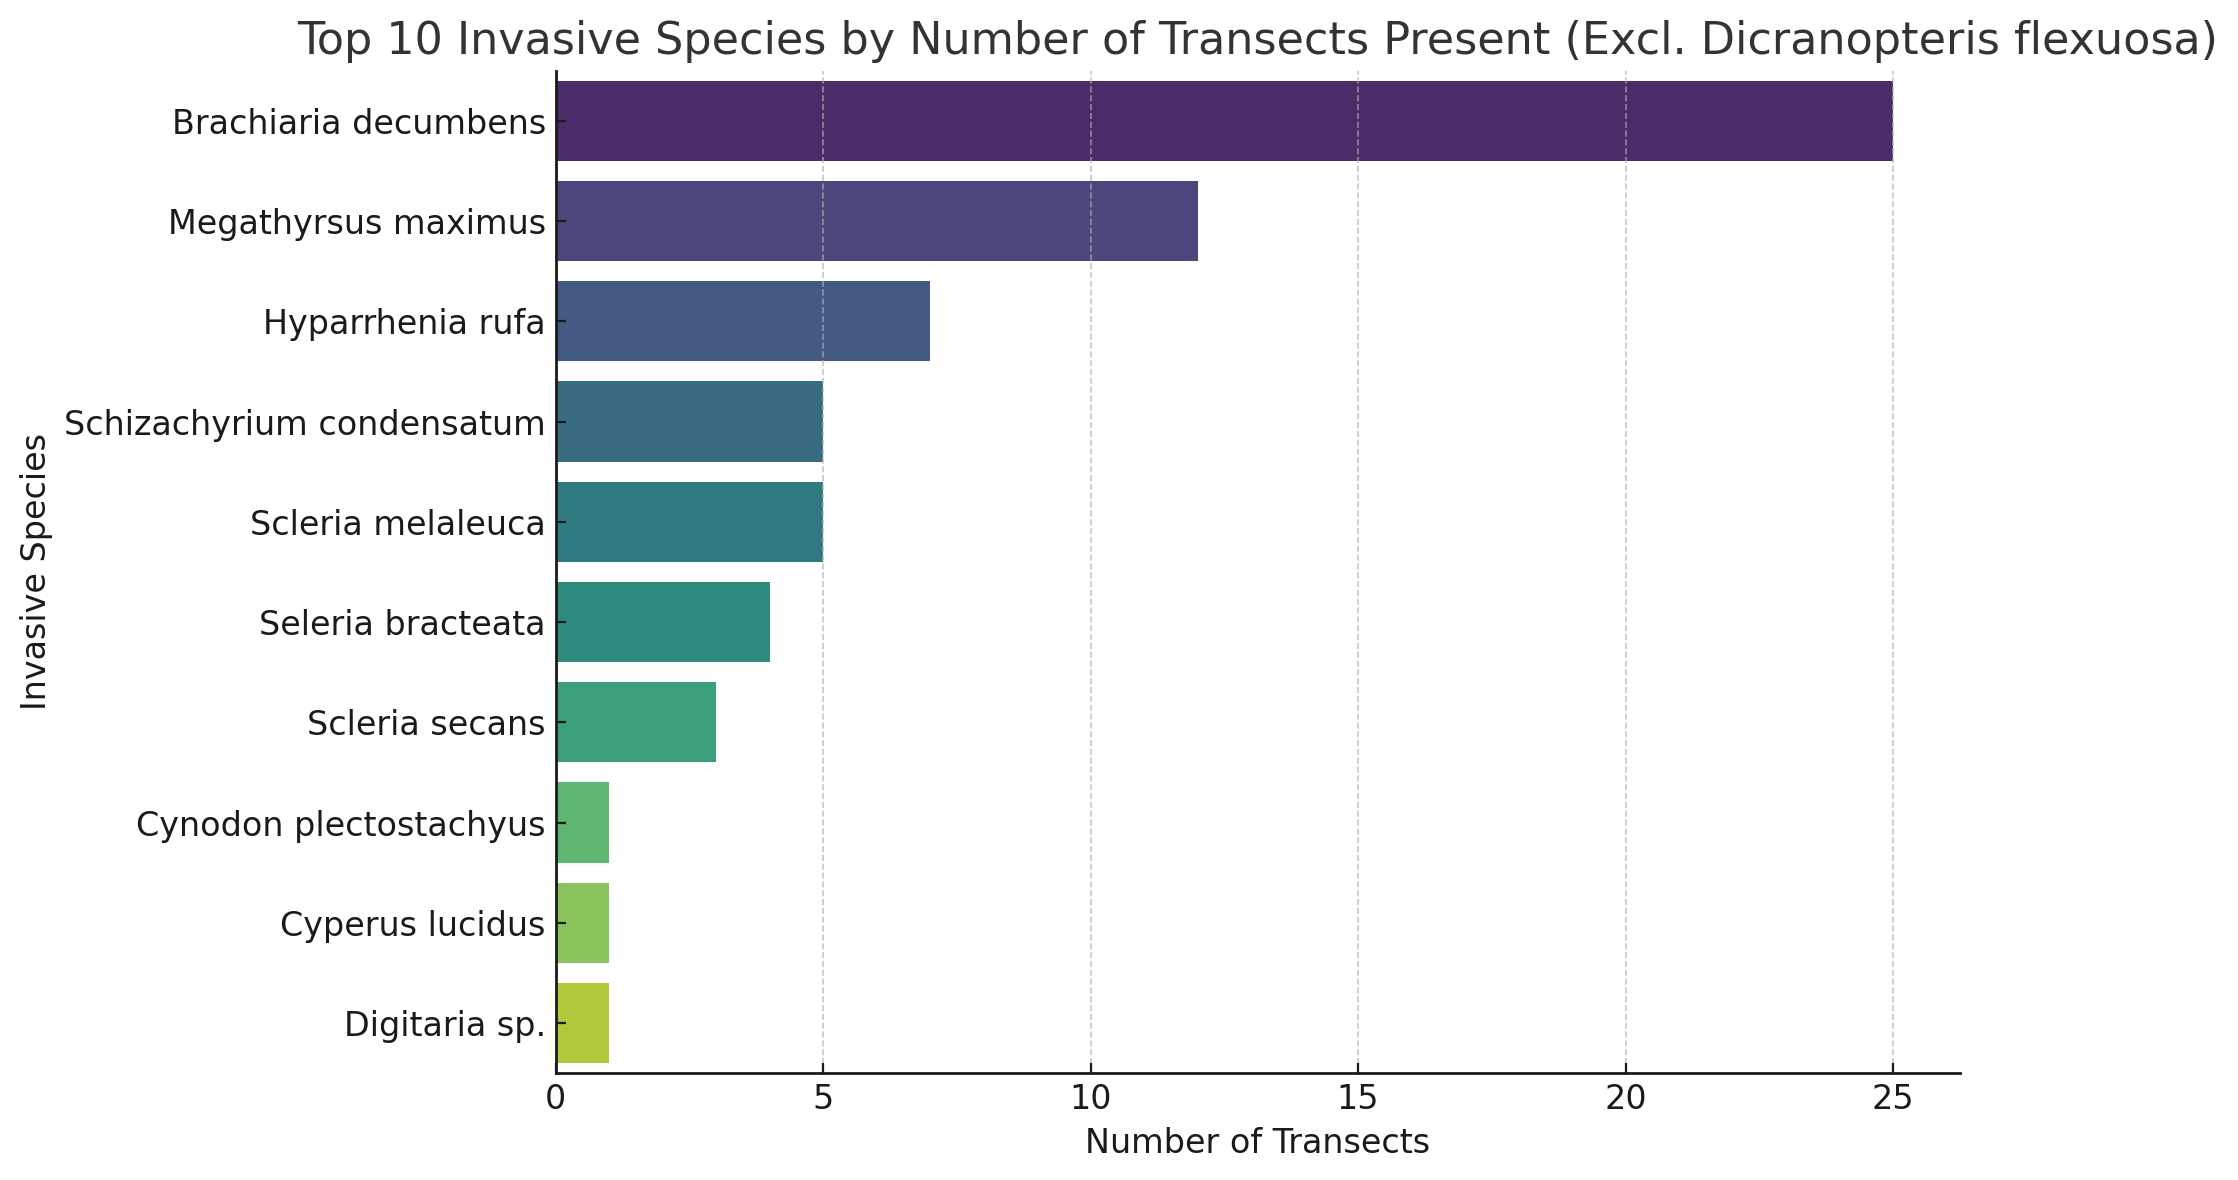
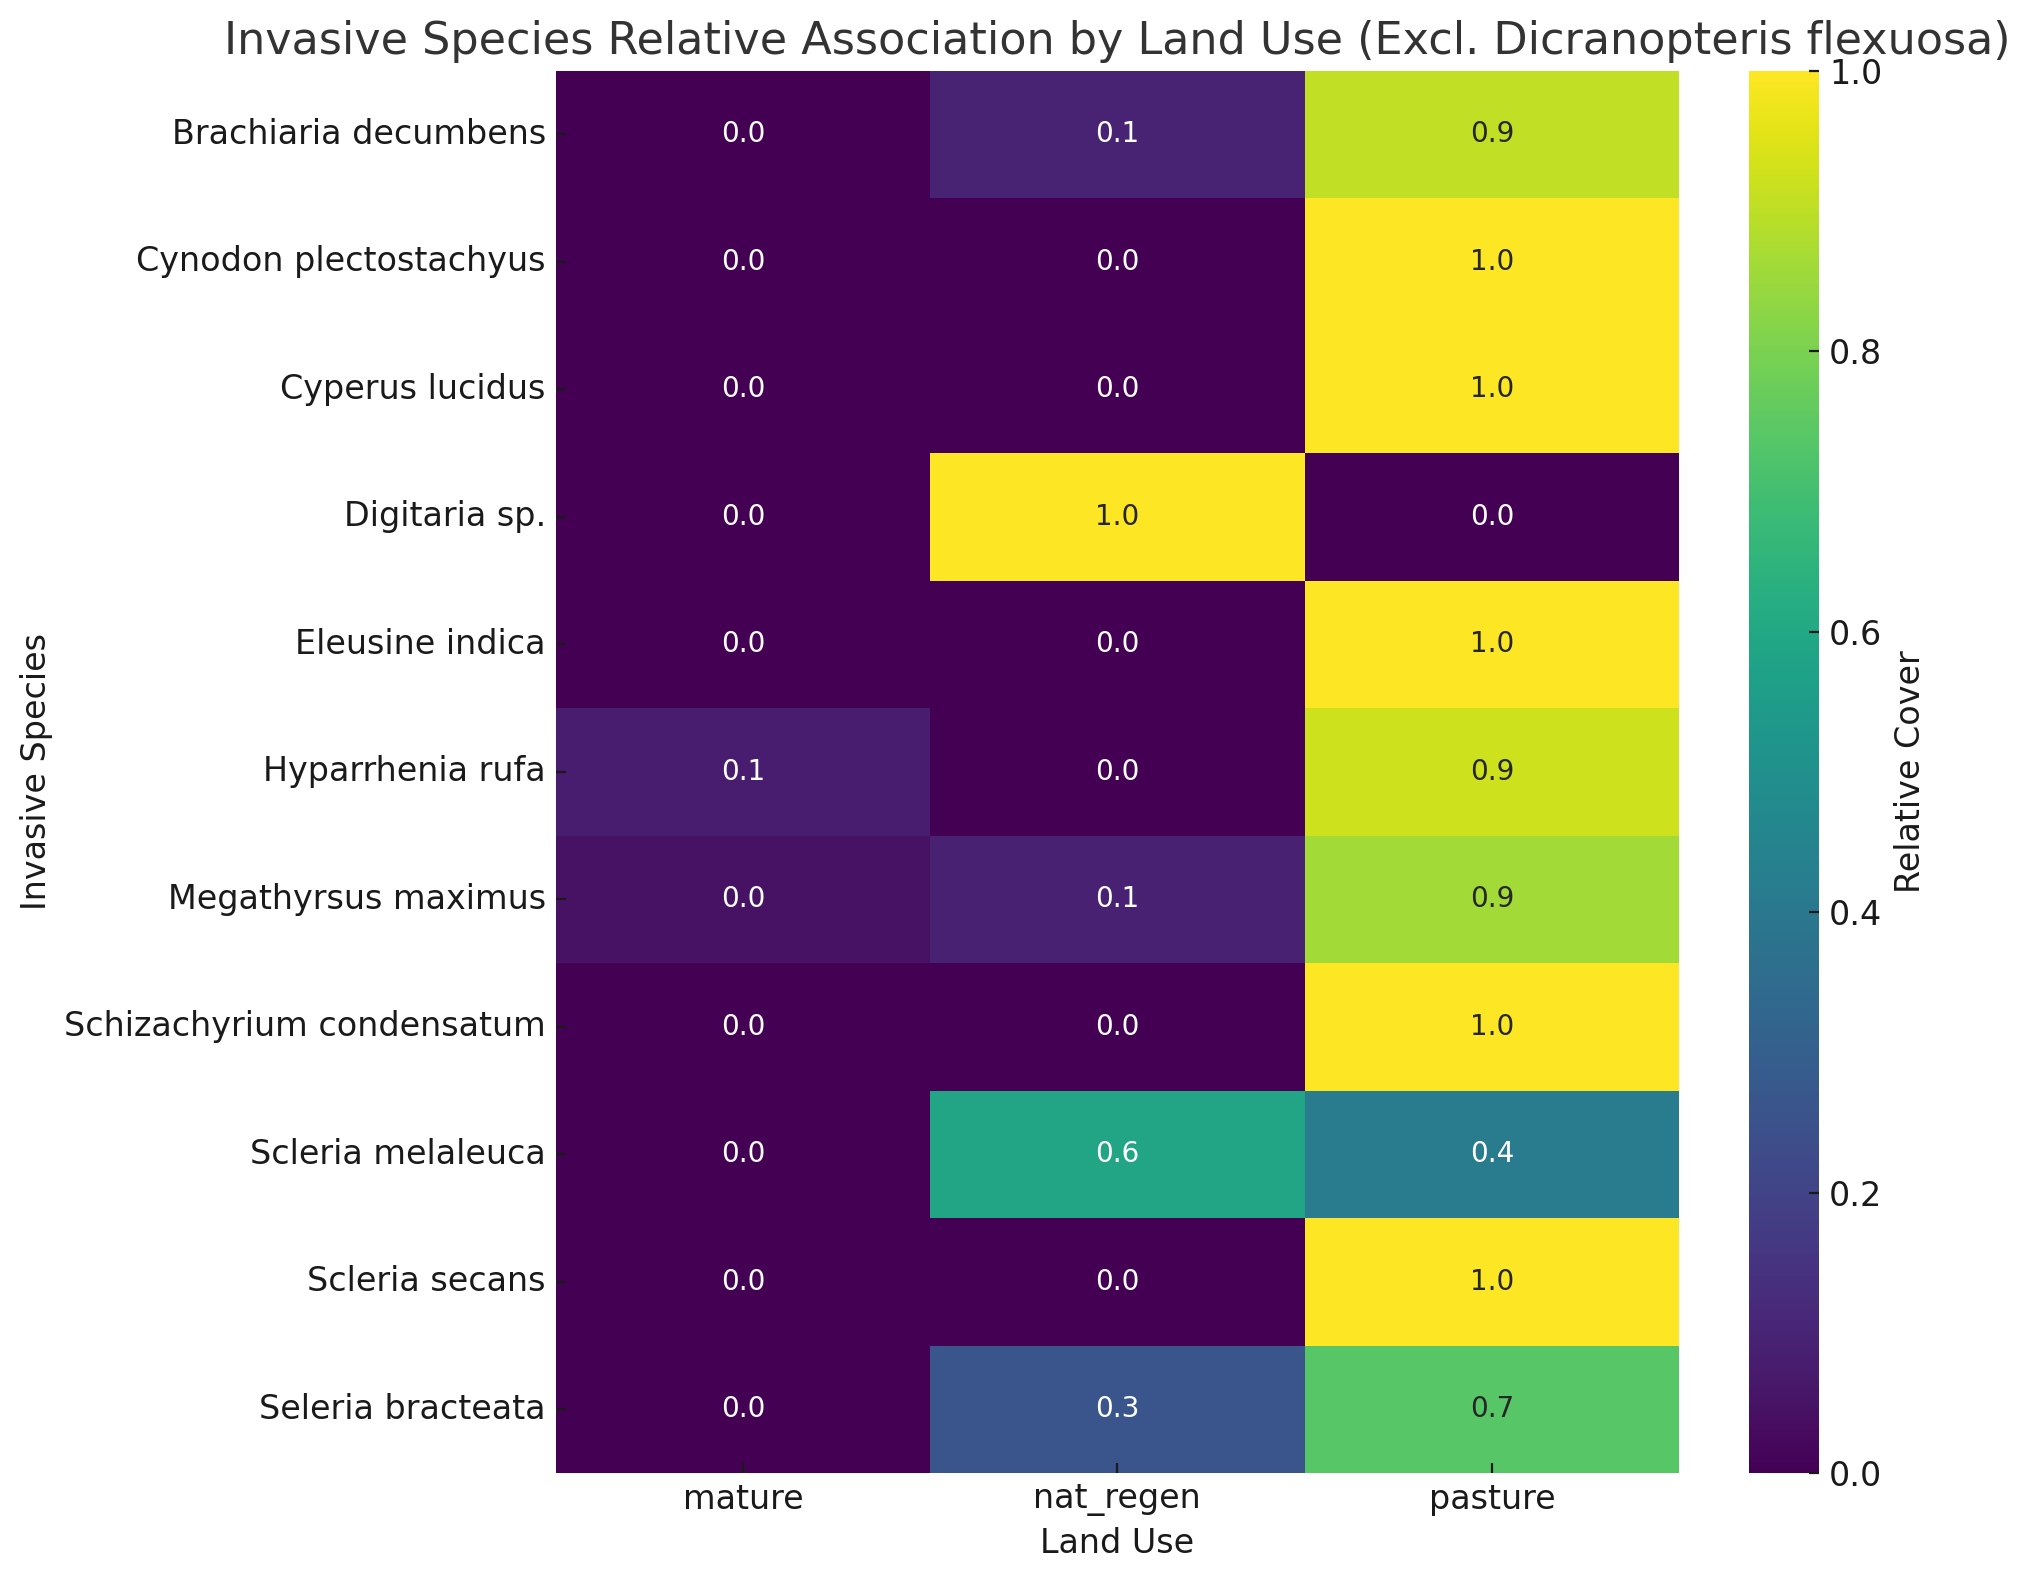
Invasive plant cover
.png)